Could this really indicate a top for stocks, Copper, and Gold?

We saw a small move up in the precious metals sector (and then back down), which is completely in tune with what I wrote yesterday, and as such, it doesn’t change the outlook.
Indicators of a possible stock market peak
Since yesterday’s comments on gold, silver, miners, and the USD Index remain up-to-date, today, I’ll focus on something else that might have a critical impact on all markets – if it happens.
Enter the stock market.
People got bullish on stocks. I get it. There’s a political change coming, and many investors might be excited about that, while I don’t think that others would be willing to sell, given this sentiment.
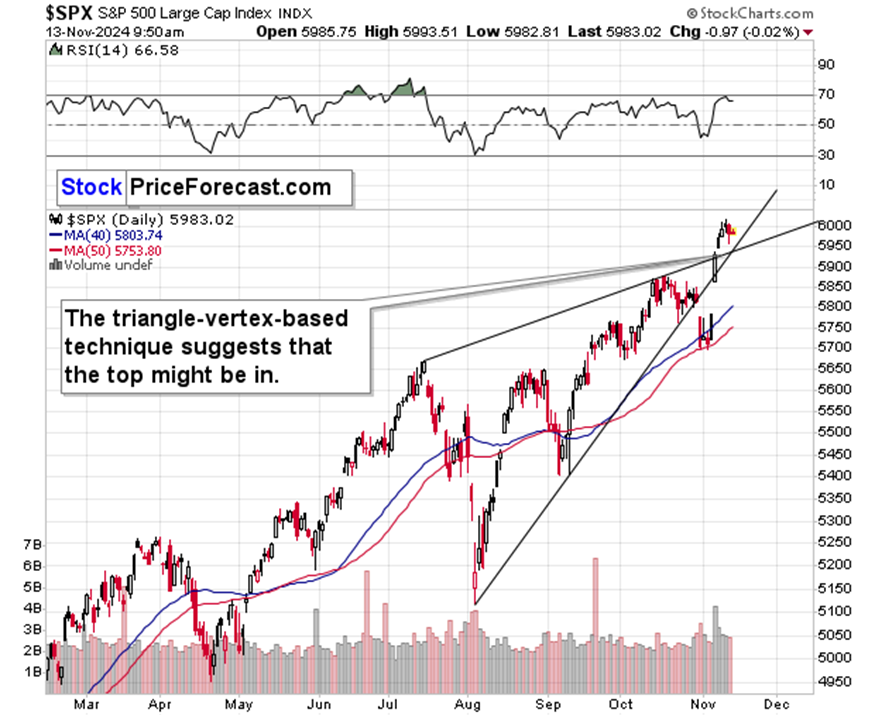
However, I have to point out that tops are formed when the sentiment is extremely bullish. While this doesn’t have to be the final top for this rally (I admit, I thought that we saw a top already, and stocks kept on rallying), I do want to stress that this is one of the moments where at least a local top becomes likely.
There are two reasons for it.
First, we have a triangle-vertex-based reversal point right now. The last move has definitely been to the upside, which means that it has bearish implications.
Second, the S&P 500 just invalidated the move above the very round (so, important from the psychological point of view) 6,000 level. This invalidation happened in terms of the closing prices, which makes it even more important than if we saw it just in intraday terms.
IF this is THE top, then the declines in silver and mining stocks (and – in particular – in junior mining stocks are about to accelerate).
The same goes for the decline in the FCX – which is a producer of both: copper and gold. I covered the situation in copper (and it doesn’t look good!) in the previous analyses, so today I’ll focus on the FCX itself.
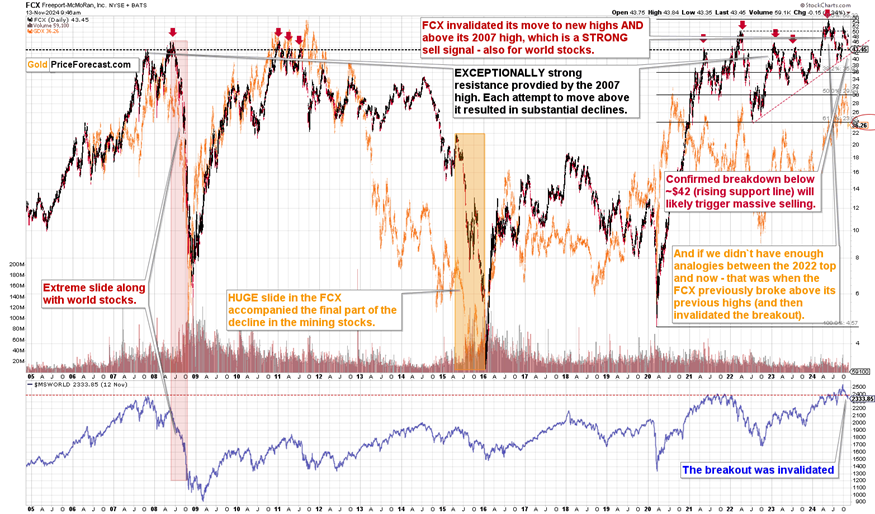
Yes, I know – there are many details on the above chart, and it might seem unreadable at first, but I assure you that it’s worth to dig into it.
There are a few signs on it suggesting that a massive house of cards is about to fall.
JNUG vs. FCX short positions
One is that we already saw an invalidation of the breakout to new all-time highs earlier this year. Right now, FCX is at its 2007 highs (yup, 17 years have passed and FCX is at the same nominal price levels), and it looks like it’s about to invalidate the move above those highs once again. Just like it did in each previous case.
The other is that the overall shape of the 2020 – now performance is very similar to what we saw between 2008 and 2011. 2011 – the year of THE top in gold, silver, and mining stocks. FCX itself started to decline from above $40 to below $4. Can it happen again? Of course.
Finally, in the lower part of the above chart, you can see that world stocks have invalidated their move above their 2007 high, which is a very bearish sign for the stock markets around the world – and also for the US stocks, as the really big moves tend to be aligned.
There’s a rising, medium-term support line that’s currently at about $42. Once FCX breaks below it and confirms this breakdown, the decline is likely to accelerate.
From the short-term point of view, we see that there’s additional support at about $41.
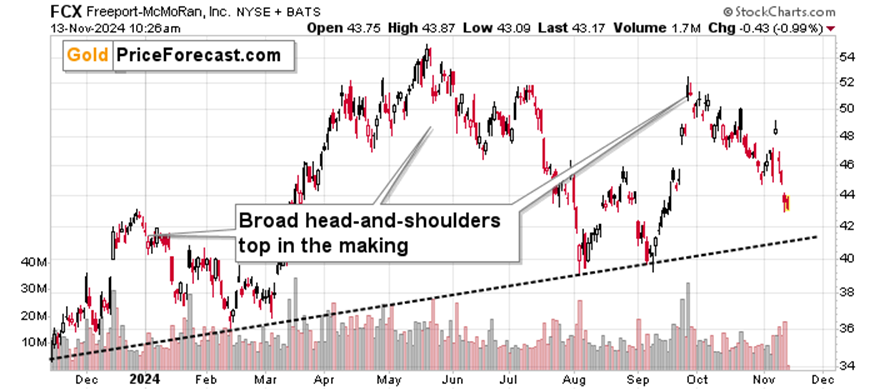
That’s where we have the neck level of the head and shoulders top pattern that’s likely in the making.
I’ve been featuring the short position in the FCX for some time now, and while the past few weeks have been very beneficial for it, it seems that it’s nothing compared to what’s to come.
The only question remains if profits from shorting JNUG (down about 15% this week alone) will outperform profits from shorting FCX. In my view – yes, as JNUG is leveraged and likely to decline also due to the inherent leverage-based-decay that all leveraged ETFs have.
Want free follow-ups to the above article and details not available to 99%+ investors? Sign up to our free newsletter today!
Want free follow-ups to the above article and details not available to 99%+ investors? Sign up to our free newsletter today!
Author

Przemyslaw Radomski, CFA
Sunshine Profits
Przemyslaw Radomski, CFA (PR) is a precious metals investor and analyst who takes advantage of the emotionality on the markets, and invites you to do the same. His company, Sunshine Profits, publishes analytical software that any


