Could July’s ECB rate hike curse reappear and cause significant Euro underperformance until year-end?
The month of July tends to bring confusing memories for ECB followers due to the respective 2008 and 2011 meetings. Both rate hikes announced back then were eventually seen as policy mistakes with the ECB quickly forced to subsequently ease monetary policy afterwards. Are there any similarities with the current ECB situation? What was the performance of euro-dollar after the July 2008 and 2011 events?
July tends to create a need for policy changes at the ECB
ECB's President Lagarde announced a strategy change at the last meeting by moving to a data-dependent stance. This considerable adjustment was mostly the product of the substantial disagreements emerging at the ECB governing council over the worsening growth outlook. A few ECB members have an extra reason to worry about since the month of July brings strange memories due to the July-2008 and July-2011 ECB meetings.
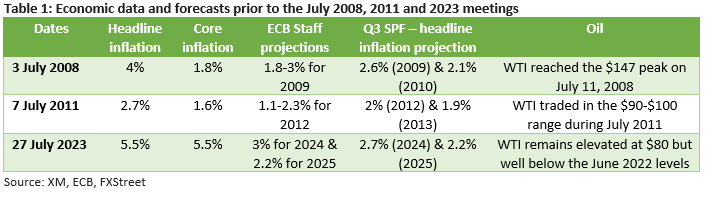
In July 2008, the then President Trichet announced a 25bps rate hike after a 13-month monetary policy pause. With oil prices trading north of $140, and the ECB staff projections and the Survey of Professional Forecasters (SPF) figures showing 1-year inflation remaining comfortably above the 2% price target, it then seemed a reasonable decision for the ECB. However, developments elsewhere, and particularly the lingering subprime crisis in the US, quickly forced the ECB to cut its refinance rate by 175 bps by year-end.
Similarly, in July 2011 President Trichet again ignored the unfolding euro area debt crisis (Greece was going through its first adjustment programme that was agreed on May 2010) and one of the sturdiest US debt ceiling episodes to announce a surprising 25bps rate hike. Contrary to 2008, ECB staff forecasts and Survey of Professional Forecasters figures showed inflation mostly under control on the examined horizon despite the elevated oil prices. Trichet et al were again quickly forced to ease monetary policy by 50bps by end-2011 as the euro area debt crisis was spreading.
Similarities and differences with 2008 and 2011
There are some interesting similarities with the current situation as seen in Table 1 above and Table 2 below. Headline inflation remains elevated, and oil prices are probably at the upper end of their recent trends in all three of these periods. Delving even further and by using the German PMI as a proxy for the euro area, we observe that the Manufacturing component prior to the 2008 and 2011 meetings was on a clear downward path. Now, this indicator is actually hovering at a very low level and signaling a continued contraction of this critical sector. On the flip side, the Services sector was growing in the three periods examined.
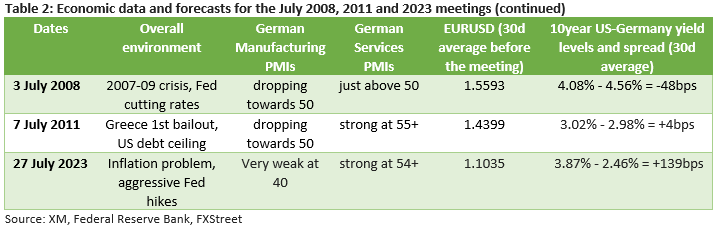
On the other hand, the situation is much different when examining market instruments. In both 2008 and 2011, the ECB was facing an extremely high euro-dollar exchange rate. As seen in Table 2, the 30-day averages leading up to the 2008 and 2011 gatherings were 1.5593 and 1.4399 respectively. These levels tend to hinder the competitiveness of euro area products and thus dampen future inflation. These levels were partly fueled by a risk-off sentiment in the markets as the US was facing its own serious issues.
This situation can also be seen at the 10-year US-German yield spread. In July 2008, the spread was in favour of the German Bunds and in July 2011 the spread was almost zero. Now, the spread is clearly favouring US Treasuries, thus adding another factor against the long-term appreciation of the euro.
What came next for Euro-Dollar in both 2008 and 2011?
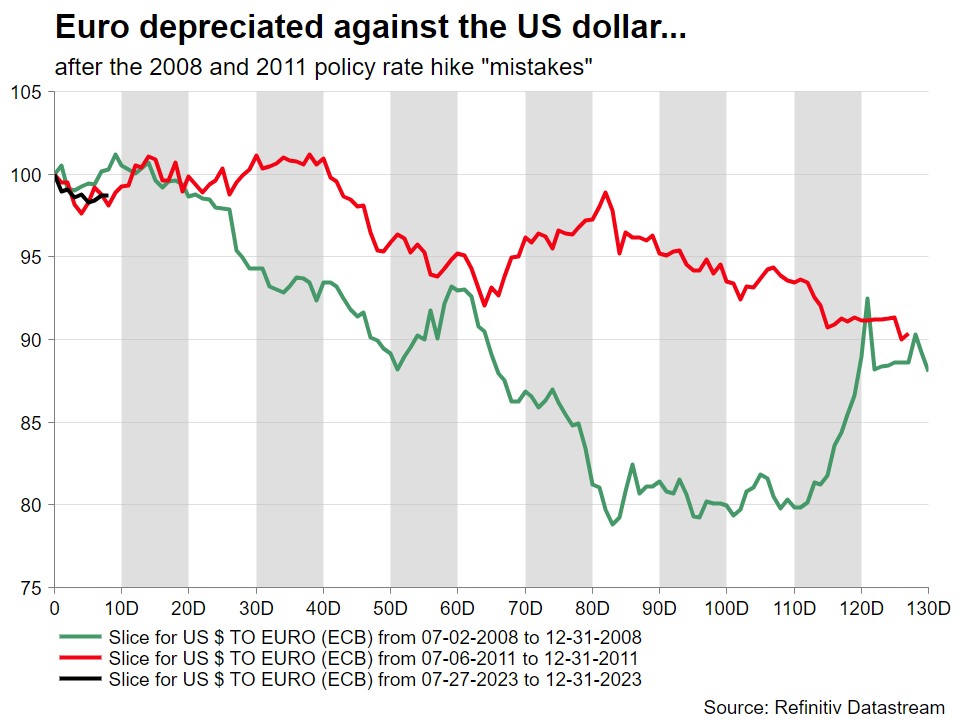
As we can see from Chart 1 below, the euro underperformed against the US dollar after both the July 2008 and 2011 rate hikes, ending each respective year 12% and 10% lower. It is currently around 1% lower since the July 27, 2023 meeting as the market is prepping for the Jackson Hole gathering in late August, and the September central banks’ meetings. Similar results can be found when examining the performance of euro-yen with the pair dropping 25% and 14% respectively by year-end in 2008 and 2011.
Has the ECB made the same mistake again?
Both rate hikes in 2008 and 2011 were seen as too hasty and eventually branded as policy mistakes with the ECB quickly forced to aggressively cut rates during the fourth quarter in both 2008 and 2011. Some would argue that the current situation is different, especially when considering the overall market sentiment and the euro-dollar level and despite the plunging PMIs. However, should the September ECB staff projections point to headline inflation being at or below 2%+ in 2025, the door would probably be shut for another rate hike during 2023. And this would remove one of the stronger euro tailwinds, potentially leading to a repeat of the 2008 and 2011 underperformance against the US dollar.
Author

Achilleas joined XM as an Investment Analyst in November 2022. He holds a BSc in Business Economics from Middlesex University and a MSc in Mathematical Trading and Finance from Bayes Business School, City University.


