Could Gold miners finally stop sliding?

There are many factors that one needs to consider when analyzing any market. Looking at a single indicator might be misleading. If it was that easy, everyone’s trades would always be profitable, right? But they aren’t.
So, yes, many additional factors need be taken into account before one forms an opinion about the market. However, let’s start with the RSI as it seems to be stealing the spotlight right now. Actually, it was something very interesting for a while now, as this indicator was just pointing to GDXJ (proxy for junior mining stocks) being the most overbought IN YEARS. Literally.

That was the top – probably the yearly top and the start of an enormous decline. And what happened this month clearly confirms this scenario.
Now, the GDXJ just touched its rising red support line that’s based on two important bottoms, and at the same time, the GDXJ-based RSI (based on daily prices) just moved slightly below 30. Both are good reasons to expect a near-term rebound in this ETF.
So, a rebound appears to be in the cards. However, whether this rebound is anything significant is a completely different matter.
You see, there were times when the GDXJ moved much higher based on the RSI at 30, and there were times when it moved back and forth and then plunged once again.
The thing is – out of the recent declines, the current move lower is most similar to what we saw a year ago, more-or-less at the same time of the year. In fact, even this most recent “seasonality” suggest that this analogy is most useful here.
If you look at late-April and early-May 2022, you’ll see that what happened was quite misleading for those that tried to take advantage of the supposed rally. The RSI was very close to 30 at the beginning, and GDXJ’s value was very close to its 200-day moving average (the red line) – just like what we see right now.
All that happened then was a relatively small upswing that was then followed by another huge wave down.
Since this is a quite likely outcome, the question is, if it’s worth to risk missing the decline in order to try to catch a dollar or two on the upside.
I might have considered this if it wasn’t for the debt ceiling issue.
The debt ceiling issue
In my view, we’re likely headed toward the obvious – that it will be raised and that there won’t be any U.S. default. And then, as the tensions subside, we might see some sort of relief rally in stocks, but gold price could decline. After all, why own a safe-haven asset if the risk of the default was neutralized? Of course, there are many other reasons, but since this risk is lower, the willingness to purchase gold is also likely to be lower (and the willingness to sell it is likely to be higher).
As we move toward the above, all sorts of information could hit the market, so it might become “obvious” to the investors that “it’s all good” any day now.
And this is why I think that a big rally here is rather unlikely.
There will be times when the short-term outlook changes in a reliable manner, but the current situation isn’t one. Of course, that’s just my opinion and my approach – feel free to adjust your trading positions however you feel is necessary based on your trading approach.
There’s also one other self-similarity present in the GDXJ that’s visible from the hourly perspective.
Zooming in on junior miners
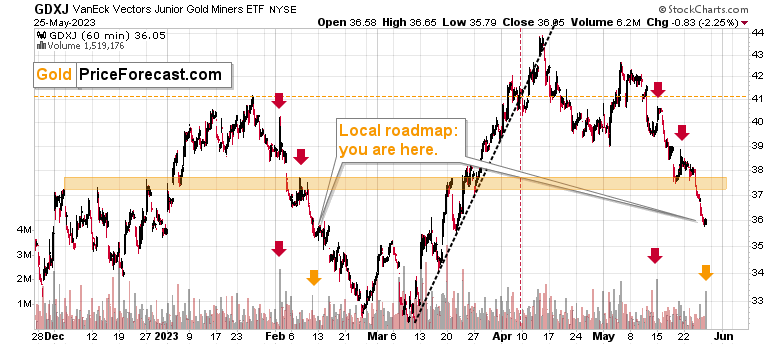
I’ve been describing the similarity between now and the January/February decline for some time now, and indeed the GDXJ has been declining in tune with it.
The red and orange arrows represent particularly characteristic and similar points during both moves lower. The quick rebounds and hourly volume spikes align remarkably well. The orange arrows emphasize that what we just saw yesterday is also something that we saw in mid-February.
If this self-similarity is likely to continue (and history does tend to rhyme), then we’re likely to see a pause and some back-and-forth trading, but not necessarily a major upswing.
And given the situation being what it is regarding the debt ceiling, the big surprise is likely to be the downside.
The previous GDXJ ETF chart shows that there are quite a few support levels every few dollars in the GDXJ, however, the support levels don’t necessarily align.
One thing that stands out is the 61.8% Fibonacci retracement that’s close to the March bottom (a bit below $33). If we get there fast, it might be a good opportunity to take profits form the current short positions in the GDXJ (like we just did in case of the previous short position in the FCX), and perhaps go long for a very short while (focusing on the easy part of the rally as we did in the previous profitable long positions).
Want free follow-ups to the above article and details not available to 99%+ investors? Sign up to our free newsletter today!
Want free follow-ups to the above article and details not available to 99%+ investors? Sign up to our free newsletter today!
Author

Przemyslaw Radomski, CFA
Sunshine Profits
Przemyslaw Radomski, CFA (PR) is a precious metals investor and analyst who takes advantage of the emotionality on the markets, and invites you to do the same. His company, Sunshine Profits, publishes analytical software that any


