Corn Elliott Wave technical analysis [Video]
![Corn Elliott Wave technical analysis [Video]](https://editorial.fxstreet.com/images/Markets/Commodities/Agriculture/corn-637443214220059978_XtraLarge.jpg)
Corn Elliott Wave analysis
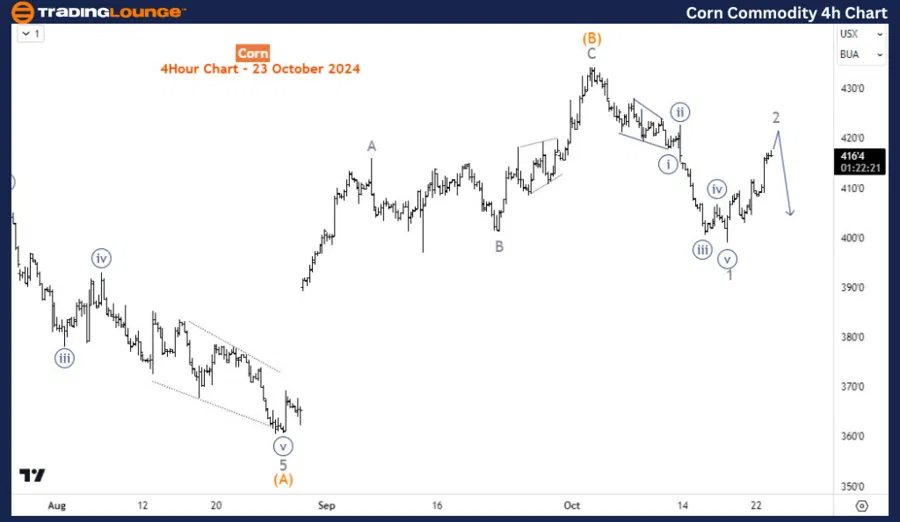
Corn is currently retracing the decline from 2nd October. If that high is not breached, the commodity can run lower in the coming weeks, to continue the larger bearish cycle from May 2024. Thus, if the current bounce fails below the 2-October high and breaks below the 17-October low, the sellers can dominate for the following weeks/months.
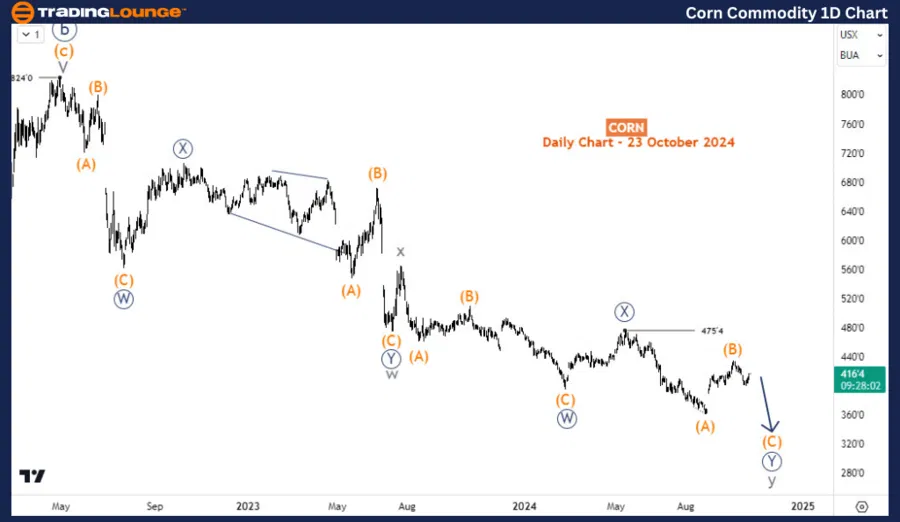
In the long term, Corn prices are in the bearish corrective phase. This phase started in July 2012 to correct the diagonal 5-wave sequence from the 70s. Corrective structures -aside triangles- are 3-waves. This corrective phase completed the first wave in April 2020 followed by strong rallies to complete the 2nd wave on April 2022. Therefore, the decline from April 2022 is expected to be the 3rd wave and could extend to $295. Thus, the corrective phase is incomplete. Hence, further decline could happen.
The daily chart focuses on this 3rd wave starting from 824. It appears to be developing into a double zigzag structure labeled in the cycle degree. After completing cycle degree waves w and x, the price is now in the wave y. Meanwhile, y is incomplete - currently in wave (C) of ((Y)) of y. However, wave (B) could still extend higher but should end below 475. To confirm the end of (B), we need to see the first lower low sequence on the H4 chart.
On the H4 chart, we have seen a 5-wave bearish reaction following the end of wave (B). The current rally is wave 2 of (C). To confirm wave (B) won’t rally further, wave 3 has to begin below the high of (B), and break below wave 1 low (17-Oct).
Corn Elliott Wave technical analysis [Video]
Author

Peter Mathers
TradingLounge
Peter Mathers started actively trading in 1982. He began his career at Hoei and Shoin, a Japanese futures trading company.


