Corn Elliott Wave analysis

Corn prices have experienced a notable rebound, rising approximately 14% since the late August 2024 low. This upward movement serves as a corrective phase against the broader decline that began in May 2024. While the short-term outlook suggests further upside potential, the medium-term analysis leans towards a bearish continuation, with prices expected to settle below the $475 mark.

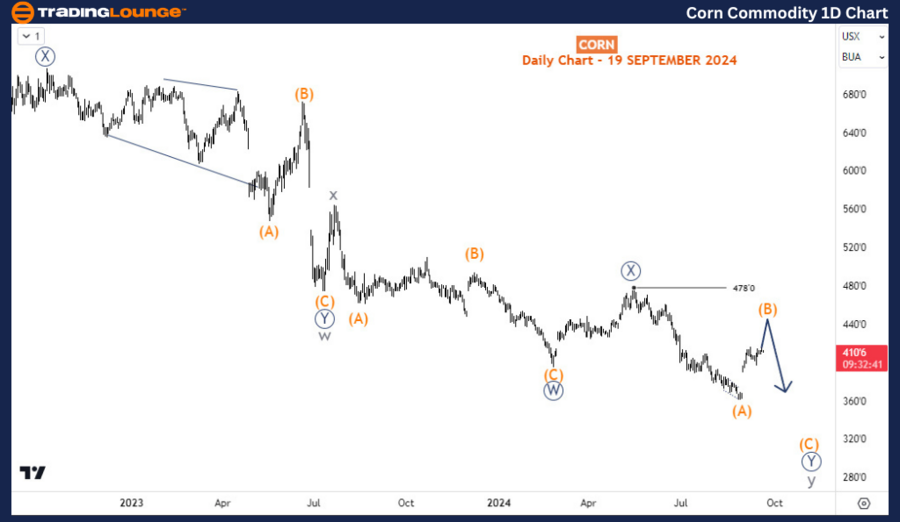
Daily chart analysis

The prevailing bearish trend in corn began in April 2022. However, this decline appears to be corrective rather than impulsive, indicating a more complex wave structure. Unless we witness an impulsive recovery, the current upward movement is likely temporary and should reverse soon. Analyzing the price action from the April 2022 high reveals a double zigzag pattern at the cycle degree. The decline from $475 is identified as an impulse wave, specifically forming wave (A) of Y (circled) within the larger cycle wave y. The ongoing bounce is classified as wave (B) of Y (circled), which ideally needs to cap below $478 to validate the current Elliott Wave count.

Corn

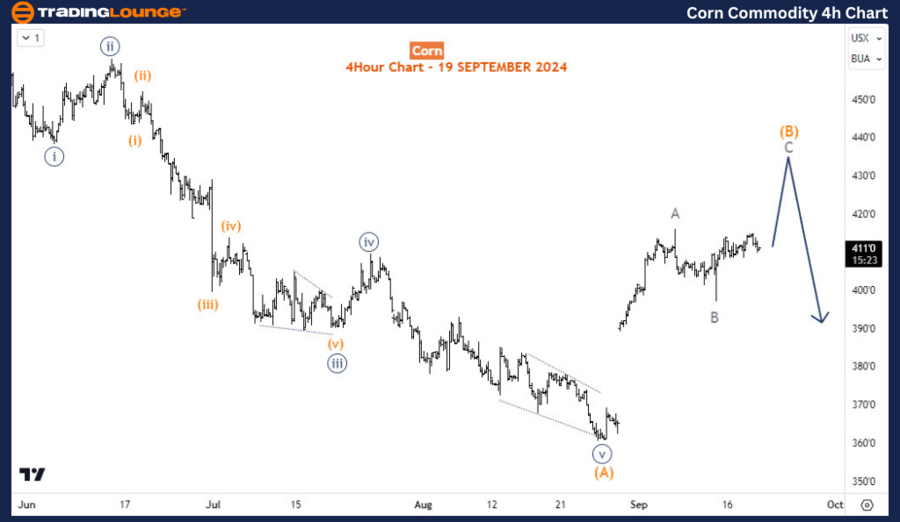
Four-hour chart analysis

Delving into the H4 chart, the recent upward momentum appears to have completed wave A of (B). Confirmation of wave B's completion will occur if the price breaks above the wave A high. Should this happen, we can expect wave C of (B) to target the 450 level. While this short-term perspective supports a corrective bounce, it is essential to recognize that the broader bearish sequence remains incomplete. This suggests that the long-term downward trend could reassert itself following the top of wave (B).

Chart


In summary, the Elliott Wave analysis of corn indicates a current corrective bounce that is likely to be short-lived. Traders should be cautious as the overall bearish trend persists, with the possibility of renewed downward movement looming as we approach critical resistance levels. Keeping an eye on wave structures and key price levels will be crucial for anticipating market shifts in the coming weeks.

Corn Elliott Wave technical analysis [Video]


As with any investment opportunity there is a risk of making losses on investments that Trading Lounge expresses opinions on.

Historical results are no guarantee of future returns. Some investments are inherently riskier than others. At worst, you could lose your entire investment. TradingLounge™ uses a range of technical analysis tools, software and basic fundamental analysis as well as economic forecasts aimed at minimizing the potential for loss.

The advice we provide through our TradingLounge™ websites and our TradingLounge™ Membership has been prepared without considering your objectives, financial situation or needs. Reliance on such advice, information or data is at your own risk. The decision to trade and the method of trading is for you alone to decide. This information is of a general nature only, so you should, before acting upon any of the information or advice provided by us, consider the appropriateness of the advice considering your own objectives, financial situation or needs. Therefore, you should consult your financial advisor or accountant to determine whether trading in securities and derivatives products is appropriate for you considering your financial circumstances.

Recommended Content


Recommended Content

Editors’ Picks

AUD/USD: The hunt for the 0.7000 hurdle

AUD/USD: The hunt for the 0.7000 hurdle

AUD/USD quickly left behind Wednesday’s strong pullback and rose markedly past the 0.6900 barrier on Thursday, boosted by news of fresh stimulus in China as well as renewed weakness in the US Dollar.

AUD/USD News
EUR/USD refocuses its attention to 1.1200 and above

EUR/USD refocuses its attention to 1.1200 and above

Rising appetite for the risk-associated assets, the offered stance in the Greenback and Chinese stimulus all contributed to the resurgence of the upside momentum in EUR/USD, which managed to retest the 1.1190 zone on Thursday.

EUR/USD News
Gold holding at higher ground at around $2,670

Gold holding at higher ground at around $2,670

Gold breaks to new high of $2,673 on Thursday. Falling interest rates globally, intensifying geopolitical conflicts and heightened Fed easing bets are the main factors. 

Gold News
Bitcoin displays bullish signals amid supportive macroeconomic developments and growing institutional demand

Bitcoin displays bullish signals amid supportive macroeconomic developments and growing institutional demand

Bitcoin (BTC) trades slightly up, around $64,000 on Thursday, following a rejection from the upper consolidation level of $64,700 the previous day. BTC’s price has been consolidating between $62,000 and $64,700 for the past week.

Read more
RBA widely expected to keep key interest rate unchanged amid persisting price pressures

RBA widely expected to keep key interest rate unchanged amid persisting price pressures

The Reserve Bank of Australia is likely to continue bucking the trend adopted by major central banks of the dovish policy pivot, opting to maintain the policy for the seventh consecutive meeting on Tuesday.

Read more
Five best Forex brokers in 2024

Five best Forex brokers in 2024

VERIFIED Choosing the best Forex broker in 2024 requires careful consideration of certain essential factors. With the wide array of options available, it is crucial to find a broker that aligns with your trading style, experience level, and financial goals. 

Read More

Majors

Cryptocurrencies

Signatures