Corn Elliott Wave technical analysis [Video]
![Corn Elliott Wave technical analysis [Video]](https://editorial.fxstreet.com/images/Markets/Commodities/Agriculture/corn2-637443207800314965_XtraLarge.jpg)
Corn Elliott Wave technical analysis
Function - Trend.
Mode - Trend.
Structure - Expected Impulse wave for (3).
Position - Wave 4 of (3).
Direction - Wave 5 of (3).
Details - Wave 4 appears to be close to completion. Wave 5 down is expected to follow to complete wave (3).
The current price action of Corn indicates a continuation of the bearish sequence that began in April 2022. Trading around the lows of October 2020, the long-term outlook suggests that the decline is part of a larger bearish cycle originating from April 2022. Given this context, selling on rebounds appears to be a prudent strategy.
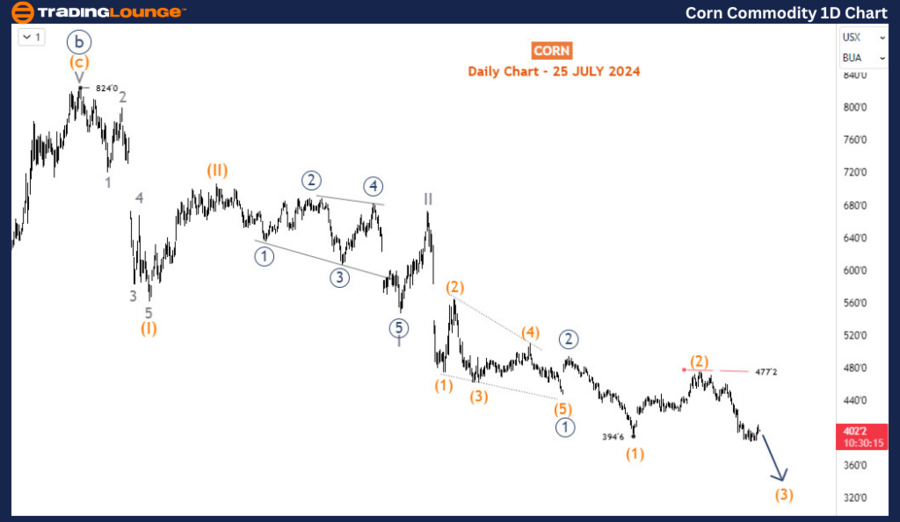
Daily chart analysis
On the daily chart, Corn exhibits a clear bearish impulse wave pattern starting from the peak of April 2022 at 824. The first two waves, (I) and (II), concluded in July 2022 and October 2022, respectively. Currently, wave (III) is in progress from the October 2022 high. Within this structure, wave (2) of 3 (circled) of III has completed, indicating that there is still considerable downside potential. Wave (3) commenced at 477'2 and is developing into a bearish impulse wave. According to Fibonacci projections, this wave could reach 345 or lower.
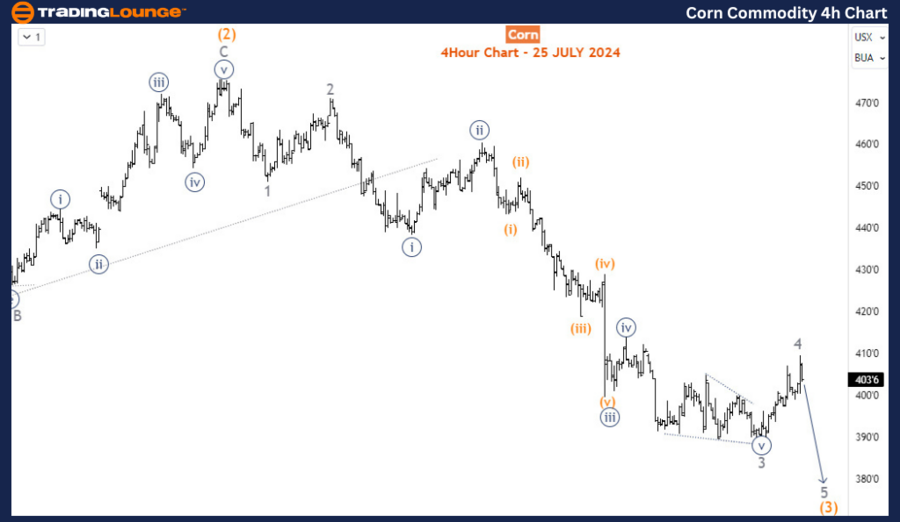
Four-hour chart analysis
The H4 chart provides a closer look at the sub-waves of wave (3). It appears that Corn has completed an extended move for wave 3 of (3). The current rebound represents wave 4, which has already touched the 23.6% retracement level of wave 3 at 409 and could potentially continue higher to the 38.2% retracement level at 420. Once this corrective structure completes, the commodity is expected to resume its downward movement in wave 5 of (3).
Summary
In summary, the Elliott Wave analysis for Corn suggests a bearish outlook both in the long term and short term. Key levels to watch include the support at 345 and resistance at 420. The analysis indicates that wave (III) is still unfolding, with wave 3 of (III) likely to push prices further down. Traders should consider selling opportunities during corrective bounces, particularly around the 420 level, as the overall trend remains bearish. By monitoring wave structures and key price levels, traders can anticipate future movements in the Corn market and make informed decisions to capitalize on the prevailing downtrend.
Corn Elliott Wave technical analysis [Video]
Author

Peter Mathers
TradingLounge
Peter Mathers started actively trading in 1982. He began his career at Hoei and Shoin, a Japanese futures trading company.


