Corn Elliott Wave technical analysis [Video]
![Corn Elliott Wave technical analysis [Video]](https://editorial.fxstreet.com/images/Markets/Commodities/Agriculture/corn2-637443207800314965_XtraLarge.jpg)
Corn Elliott Wave analysis
Function - Trend.
Mode - Trend.
Structure - Expected Impulse wave for (3).
Position - Wave iii (circled) of 3.
Direction - Wave iii (circled) of 3 is still in progress.
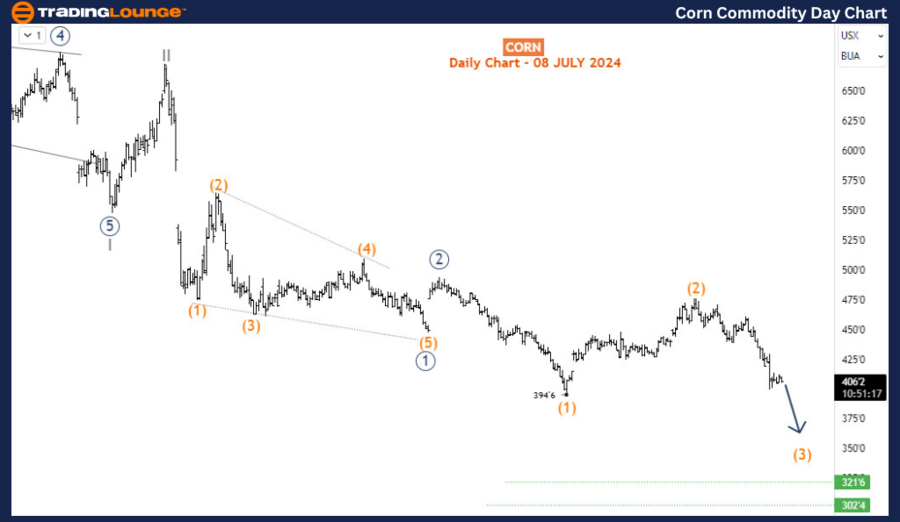
Details - It appears wave (2) has already been completed as per the daily chart. We are now in wave (3) which is expected to drop below the 400 mark.
Corn prices extended their sell-off from May 14th and are poised for further declines after breaking out of the sideways structure that formed in July. This ongoing downtrend suggests that the commodity will likely trade below $400 before a corrective rebound materializes.
Daily chart analysis
On the daily chart, we have been tracking the latter part of a significant bearish impulse that began in April 2022. This impulse wave is currently navigating its third wave - wave (III) of the super cycle degree. The completion of wave II of (III) occurred in January 2023, and the price is now unfolding the sub-waves of wave III of (III). Specifically, the daily chart indicates that the price is favoring the downside in wave (3) of 3 (circled) of III. This chain of third waves within third waves (a fractal characteristic of Elliott Waves) implies that Corn prices will likely sink much lower in the coming months. The next significant breakdown is expected to push the commodity below the previous low of 394'6, potentially reaching levels not seen since 2020. Our primary focus now is to analyze wave (3) in detail and find optimal positions along this bearish trend.
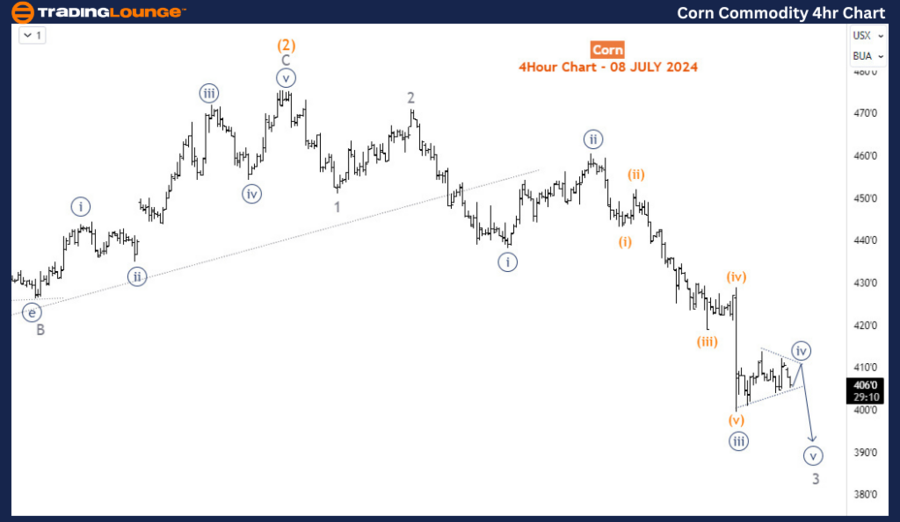
Four-hour chart analysis
On the H4 chart, the price action is yet to complete wave 3 of (3). The market is currently consolidating in a sideways movement, which is indicative of the 4th sub-wave of 3. This suggests that there may be a selling opportunity once the price breaks down from this consolidation, targeting the 5th sub-wave of 3. However, a more favorable trading opportunity might present itself after the completion of the wave 4 corrective bounce. Traders should anticipate potential SHORT positions at the end of wave 4, aiming to capitalize on the subsequent sell-off in wave 5 of (3) before a larger corrective bounce for wave (4) begins.
In conclusion, both the daily and H4 charts point towards a continued bearish trend for Corn prices, with multiple opportunities for traders to position themselves for further declines. By closely monitoring the unfolding of wave (3) on the daily chart and the sub-waves on the H4 chart, traders can identify strategic entry points to maximize their returns amidst this downward movement.
Corn Elliott Wave technical analysis [Video]
Author

Peter Mathers
TradingLounge
Peter Mathers started actively trading in 1982. He began his career at Hoei and Shoin, a Japanese futures trading company.


