Corn Elliott Wave technical analysis [Video]
![Corn Elliott Wave technical analysis [Video]](https://editorial.fxstreet.com/images/Markets/Commodities/Agriculture/corn5-637443207812362641_XtraLarge.jpg)
Corn Elliott Wave analysis
Function - Trend.
Mode - Counter-Trend.
Structure - Impulse wave.
Position - Wave 3 of (3).
Direction - Wave 3 of (3) is still in progress.
Details - Wave 3 appears to be on a decent momentum upside but more is needed to increase the likelihood above wave 1 high. The invalidation level remains at 438’.
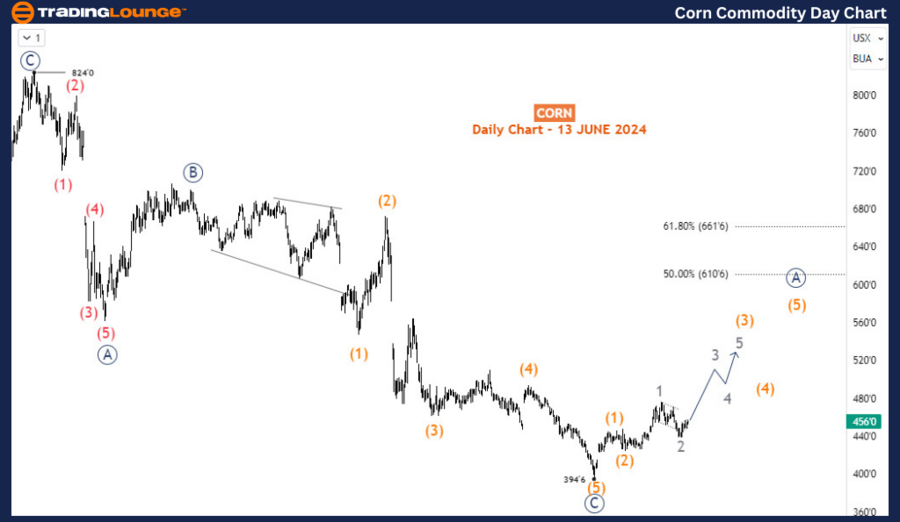
Corn prices have experienced a substantial surge, increasing over 16% from the February 2024 low. However, this is only a 16% recovery from the April 2022 to February 2024 sell-off, indicating that there is still significant upside potential. From an Elliott wave perspective, the current recovery is expected to extend higher, potentially correcting up to the 610-661 Fibonacci retracement area. This analysis aims to show traders how to capitalize on this bullish corrective cycle.
Daily chart analysis
On the daily chart, the recovery from the February 2024 low of 394’6 is anticipated to evolve into either an impulse wave or one of the zigzag structures. Assuming an impulse wave of intermediate degree from that low, it appears the price is still in wave (3), which could be an extended one based on the sub-waves 1 and 2. By projection, wave (3) could reach 523, provided the wave (2) low is not breached.
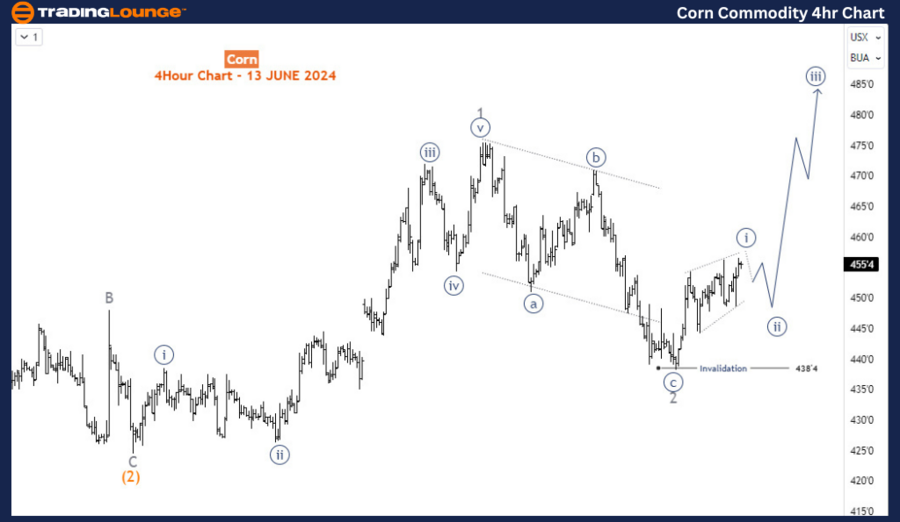
H4 chart analysis
On the H4 chart, wave 2 of (3) ended at 438’4 with a zigzag structure, and the price is now reacting upwards as part of wave 3. It appears that wave i (circled) of 3 is completing with a diagonal structure, suggesting a pullback for the corresponding wave ii (circled) could occur before the price resumes its upward movement. As long as 438’4 remains unbreached, wave 2 stays valid at this level, and wave 3 is in progress with the potential to reach 523 in the coming weeks.
Summary
Corn prices have surged over 16% from the February 2024 low but have only recovered a fraction of the earlier sell-off from April 2022 to February 2024. The Elliott wave analysis suggests that the current recovery is likely to extend higher, targeting the 610-661 Fibonacci retracement area. On the daily chart, the recovery from the February 2024 low is evolving into an impulse wave, with wave (3) potentially reaching 523, provided wave (2) low remains unbreached. On the H4 chart, wave 2 of (3) ended at 438’4, and the price is progressing upwards in wave 3. A pullback for wave ii (circled) may occur, but as long as 438’4 holds, wave 3 is expected to continue towards 523 in the coming weeks.
Traders should monitor the key levels of 438’4 and 523 to gauge the continuation of the bullish trend and to identify potential entry and exit points.
Technical analyst: Sanmi Adeagbo.
Corn Elliott Wave analysis [Video]
Author

Peter Mathers
TradingLounge
Peter Mathers started actively trading in 1982. He began his career at Hoei and Shoin, a Japanese futures trading company.


