Copper’s not-so-hidden signal for Gold

The markets don’t move in a straight line – they correct every now and then and that’s normal.
A normal correction amidst USD strength
This appears to be taking place in gold and mining stocks right now. It’s not only a general tendency for the markets to correct in this way that should one doubt the healthiness of the current “upswing” in the precious metals market, but the same goes for the analogy to the only period from the recent history that’s similar to the current situation in the USD Index.
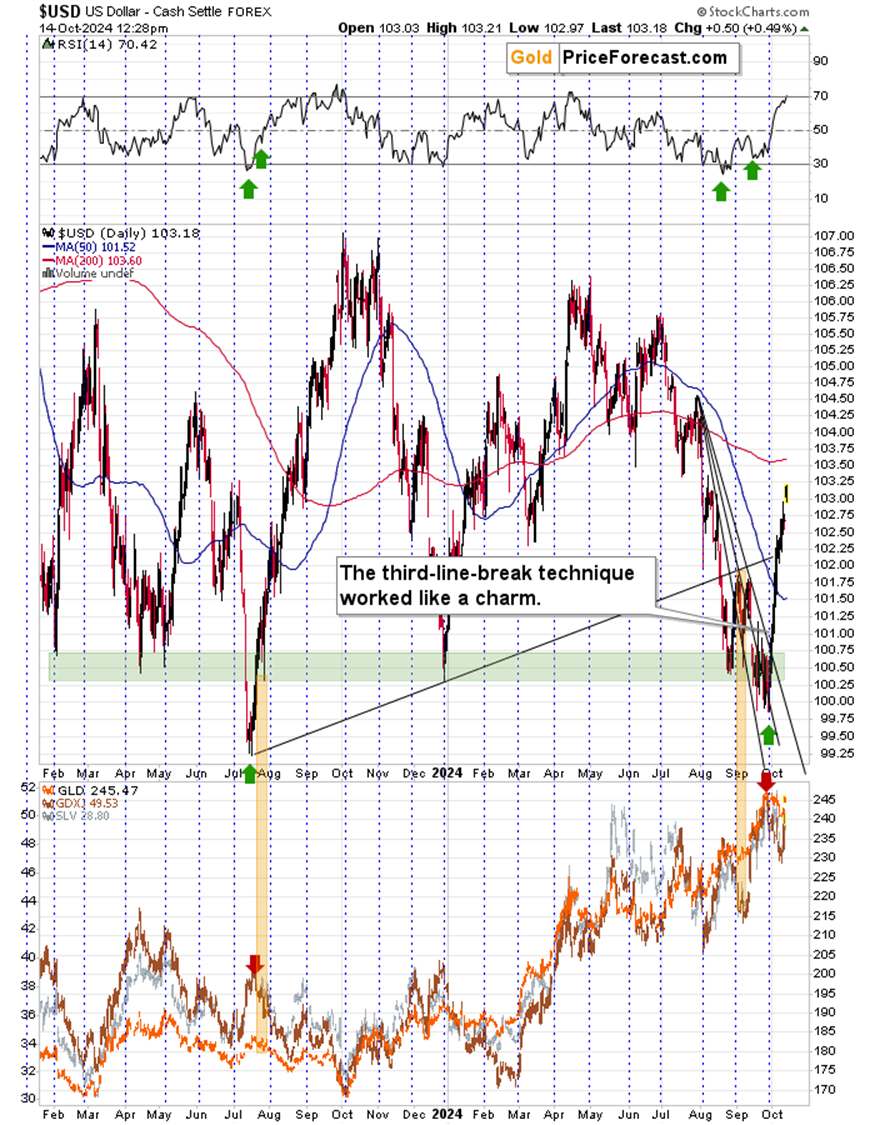
The USD Index soared from below 100 and it continues to soar even today. As the RSI moved over 70, we might see a correction here, but it’s unlikely to be something write home about – back in 2023 we saw only brief corrections that were then quickly followed by new highs.
GDXJ and USD index repeating patterns
But that’s not want to put emphasis on today. What I want to emphasize is what happened in the GDXJ in mid-2023 during the early part of USD Index’s rally (and GDXJ’s decline).
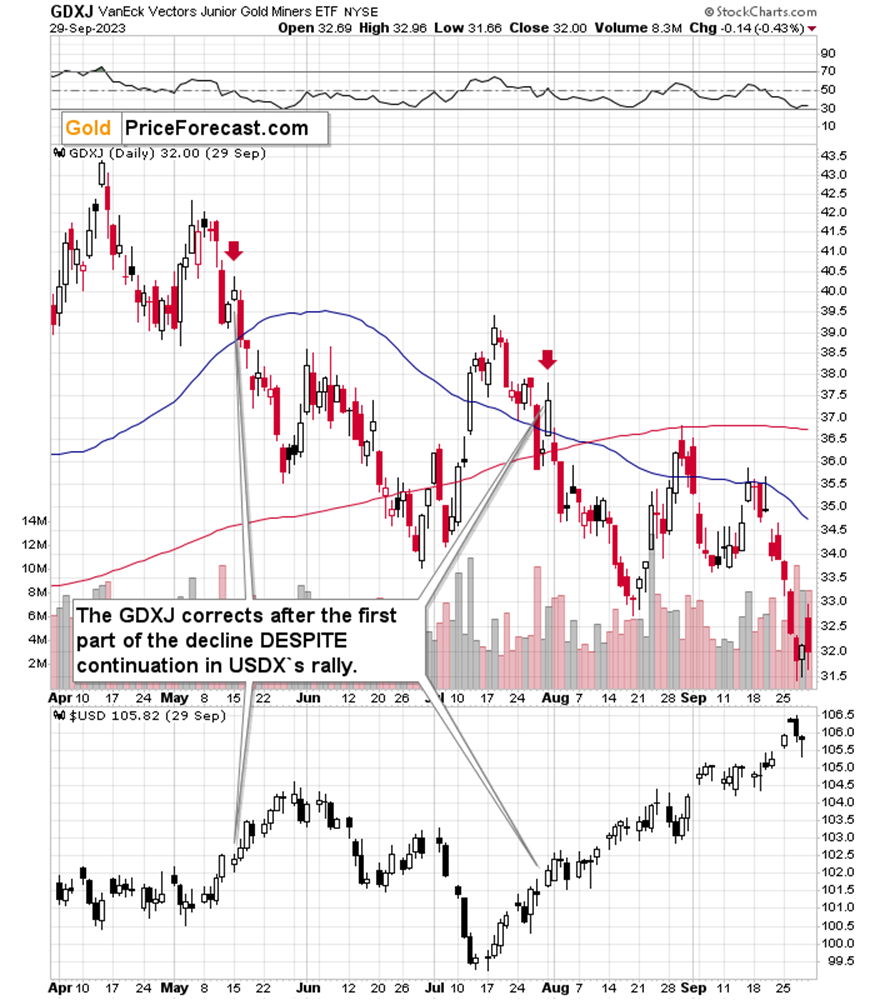
In late July 2023 – after about two weeks of the moves in the GDXJ and the USD Index – we saw a correction in the GDXJ despite lack thereof in the USDX.
It took two days, and we saw a kind of intraday reversal right before the GDXJ returned to the decline mode.
Where are we now?
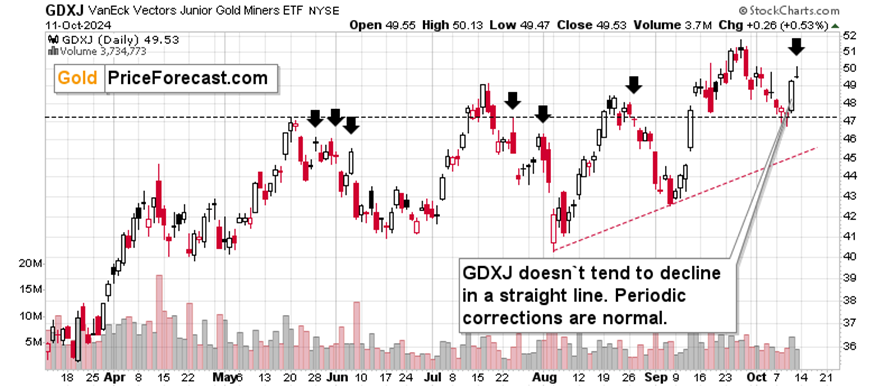
It’s approximately two weeks after the GDXJ’s top and USD Index’s bottom and we saw a quick rally. Friday’s session was also an intraday reversal.
This happened without meaningful action in the USD Index.
What does it mean? It means that something… normal is taking place. It’s not a bullish game-changer, nor a breakout.
And speaking of verifications of breakdowns – let’s take a look at the copper market. It’s important as big moves in it are usually correlated with big moves in the precious metals market.
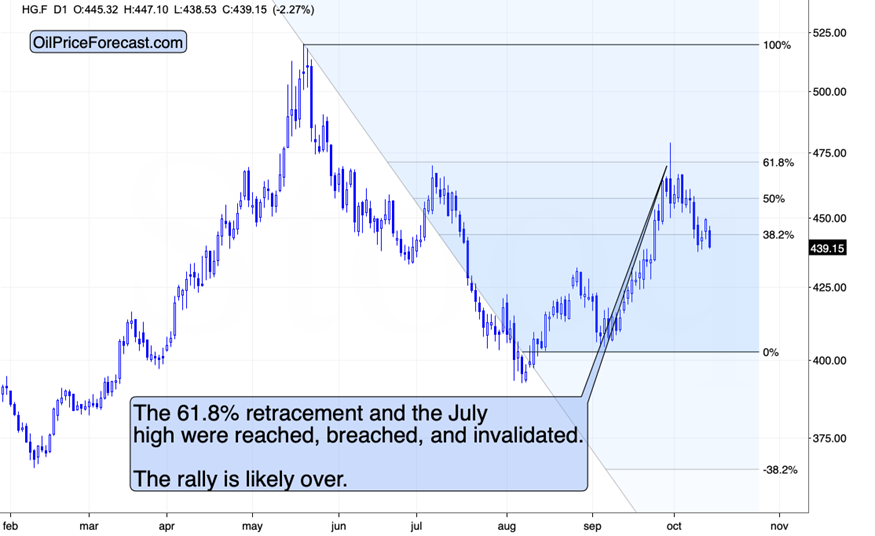
Copper moved higher on Friday, but this rally was very short-lived – it was already more than erased in today’s pre-market trading.
This further confirms that the top formed at the end of September, when copper tried to move above its 61.8% Fibonacci retracement and the July high. The invalidation was a sell signal that is now being followed by a decline.
This move lower is likely to continue.
This is not based primarily (!) on the above chart, though – it just confirms what’s likely based on copper’s long-term chart.
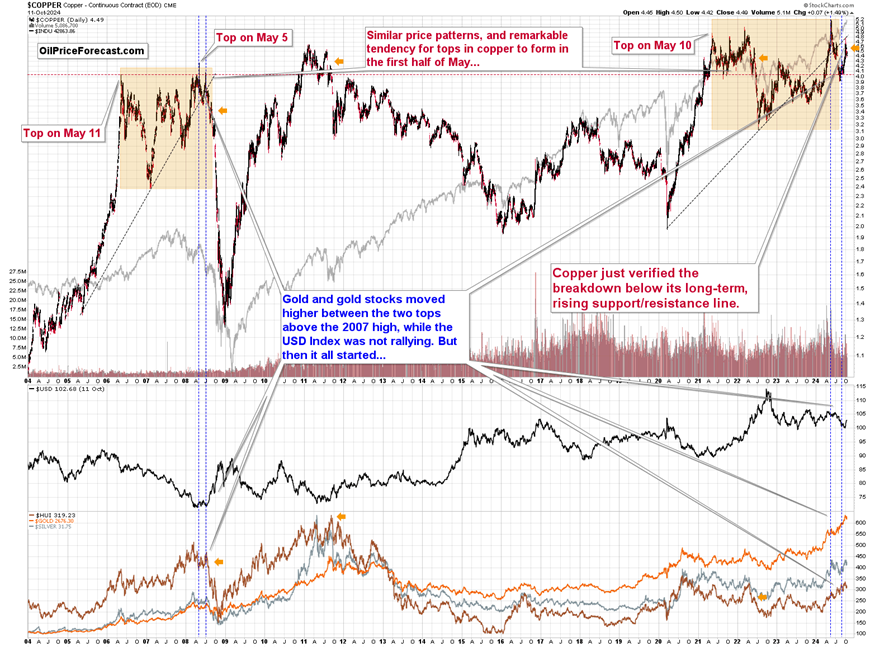
The entire August-September 2024 rally was a verification of the breakdown below the rising, long-term support/resistance line that started at the 2020 bottom. After all, this line is where copper reversed.
What is striking about copper’s current performance is that quite sharp (from the long-term point of view) corrections after the first part of the move lower are to be expected and therefore what we saw perfectly fits the broader bearish pattern.
Please consider the situations that I marked with yellow arrows. Each final top in the past 20 years was followed by this kind of rally.
What’s particularly interesting from our point of view, is that those cases were generally great shorting opportunities in case of mining stocks, silver, and gold – I marked those cases with yellow arrows in the lower part of the chart.
Is getting excited about copper’s recent “strength” therefore justified? Yes, but only as long you are positioned to benefit from the likely decline. Some long-term opportunities’ (in silver) continue to look favorable, though.
Want free follow-ups to the above article and details not available to 99%+ investors? Sign up to our free newsletter today!
Want free follow-ups to the above article and details not available to 99%+ investors? Sign up to our free newsletter today!
Author

Przemyslaw Radomski, CFA
Sunshine Profits
Przemyslaw Radomski, CFA (PR) is a precious metals investor and analyst who takes advantage of the emotionality on the markets, and invites you to do the same. His company, Sunshine Profits, publishes analytical software that any


