Copper Elliott Wave technical analysis [Video]
![Copper Elliott Wave technical analysis [Video]](https://editorial.fxstreet.com/images/Markets/Commodities/Metals/Copper/copper-wire-530233_XtraLarge.jpg)
Copper Elliott Wave analysis
Copper prices have started to recover from their August 2024 low, but the current bounce appears corrective. While the short-term outlook remains bullish, this upside movement will likely be followed by a renewed downtrend once the bullish corrective cycle concludes. Here's a detailed Elliott Wave analysis of Copper's price action and what traders can expect in the near future.
Long-term chart analysis
Since March 2020, Copper has been unfolding into a diagonal structure at the supercycle degree. Wave (I) of this structure peaked in March 2022, and Wave (II) ended in July 2022. The following expansive Wave (III) took prices higher, concluding in May 2024. After this peak, Copper entered a corrective phase, which is now evolving as Wave (IV) of the supercycle degree.
Wave (IV) appears to be forming a complex double zigzag corrective structure, which is commonly seen during larger corrections in Elliott Wave analysis. A double zigzag typically involves two distinct corrective waves linked by an intervening corrective wave (commonly referred to as a wave "X"). The current bounce is labeled as cycle degree Wave x of (IV), indicating that it is part of this larger correction phase.
While this bounce is likely to offer short-term opportunities for traders, it remains part of a larger bearish corrective phase. The double zigzag pattern suggests that further downside is expected once the current correction is complete.
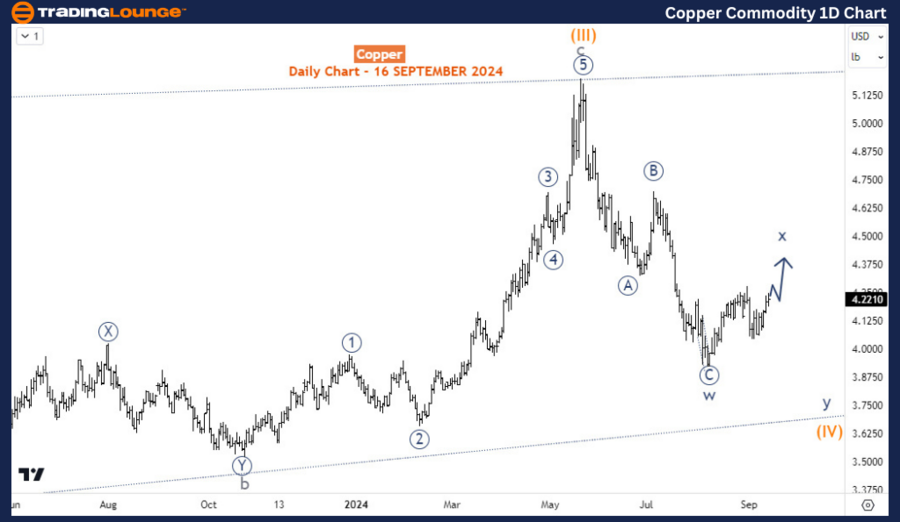
Daily chart analysis
The daily chart shows that cycle degree Wave w of (IV) was likely completed in early August 2024, marking the end of the first corrective leg in the double zigzag structure. Following this, the market has entered a corrective bounce, which is identified as cycle degree Wave x of (IV).
Elliott Wave principles suggest that Wave x should unfold as a three-wave structure. Currently, Copper appears to be in the third leg of this corrective rally, with the potential for further upside. However, given that this move is corrective, it is likely to be short-lived. Once Wave x completes, Copper could resume its downtrend as the final leg of the double zigzag pattern, Wave y of (IV), unfolds.
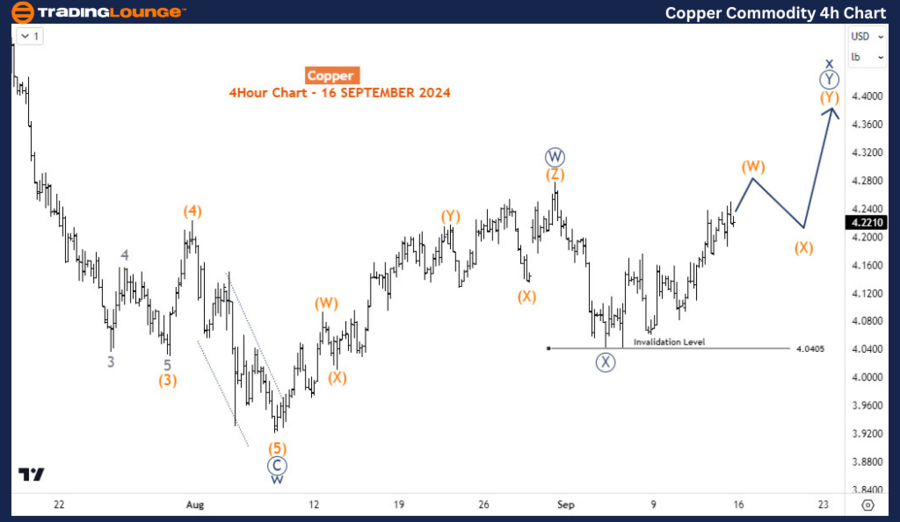
Four-hour chart analysis
On the H4 chart, we see that primary degree waves W (circled) and X (circled) of cycle Wave x of (IV) were completed on August 30th and September 5th, 2024, respectively. Following the low in early September, wave Y (circled) has emerged, and this final leg of the current corrective rally is expected to push prices higher in the short term.
Wave Y (circled) could extend toward the $4.4 level in the coming days, with support expected to hold above the $4.04 region. This short-term move provides a bullish outlook, but traders should remain cautious as the long-term bearish trend is still in play. Once this corrective rally ends, the broader sell-off from May 2024 may resume, leading to another significant decline in Copper prices.
Conclusion
Copper is amid a corrective bounce within a larger bearish Elliott Wave structure. The current rally, identified as cycle degree Wave x of (IV), is expected to extend toward $4.4 in the short term. However, the larger double zigzag pattern forming in Wave (IV) suggests that further downside is likely once this corrective phase concludes. While short-term traders may benefit from the current upside momentum, the longer-term outlook remains bearish, and traders should be prepared for a resumption of the downtrend in the coming weeks.
Copper Elliott Wave technical analysis [Video]
Author

Peter Mathers
TradingLounge
Peter Mathers started actively trading in 1982. He began his career at Hoei and Shoin, a Japanese futures trading company.


