Copper Elliott Wave technical analysis [Video]
![Copper Elliott Wave technical analysis [Video]](https://editorial.fxstreet.com/images/Markets/Commodities/Metals/Copper/copper-pipes-production-22855663_XtraLarge.jpg)
Copper Elliott Wave analysis
Function - Counter-Trend.
Mode - Corrective.
Structure - Zigzag.
Position -Wave 4.
Direction - Wave 5.
Details - It appears wave 4 has been completed but we need a confirmation above 4.686 with an impulse break. Otherwise, the price could make a minor corrective bounce below the confirmation level and falter further.
Copper prices are reversing upward, recovering from the sell-off that began on May 20, 2024. The broader picture indicates that this sell-off is a correction within the larger bullish cycle that started in October 2023. The current recovery, which began on June 18, 2024, has the potential to rise further and possibly break the high from May 20, 2024.
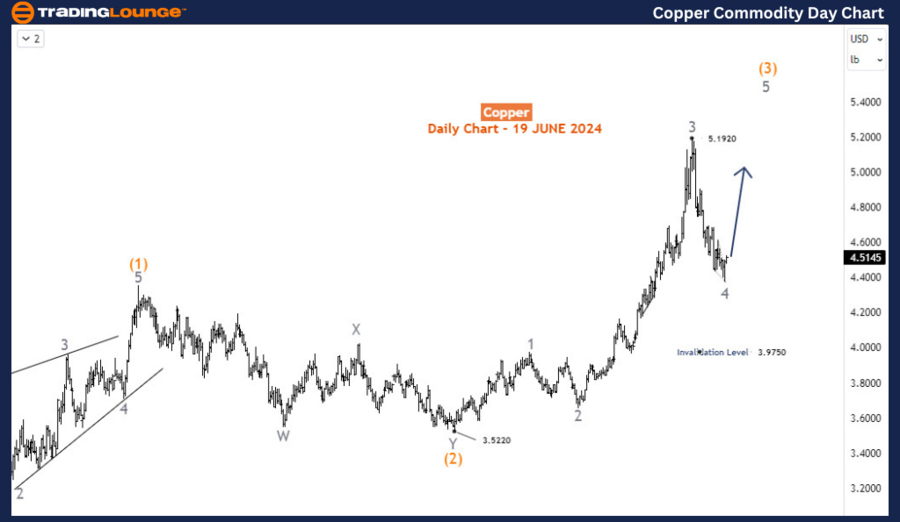
Daily chart analysis
On the daily chart, a bullish impulse wave has been developing since July 2022, when copper hit a low of $3.13. This impulse wave is currently in wave (3). Specifically, wave 3 of (3) concluded at $5.192, and wave 4 of (3) likely ended at the low on June 18. We can anticipate copper prices to recover into wave 5, completing wave (3) above $5.192 before the next pullback for wave (4) occurs. The invalidation level for this wave count is at $3.975.
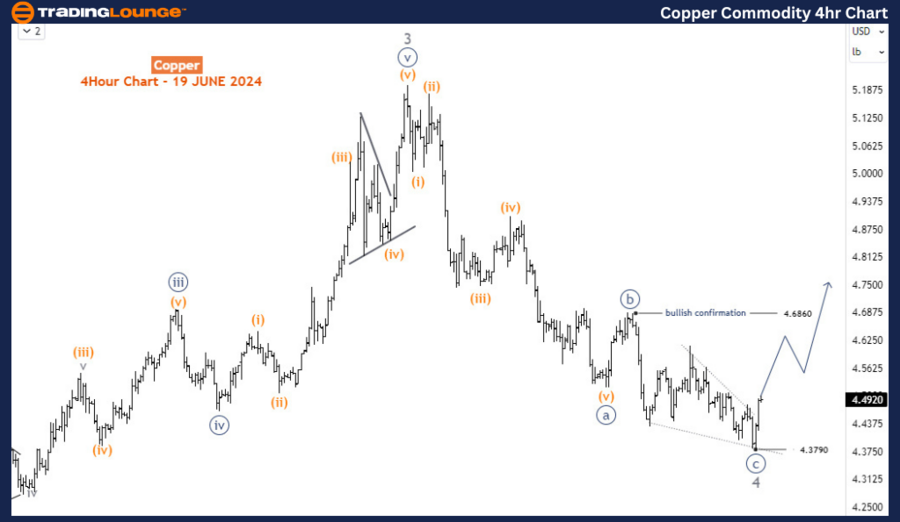
Four-hour chart analysis
On the H4 chart, wave 4 appears as a double zigzag pattern. Wave a (circled) of 4 ended with an impulse structure, while wave c (circled) concluded with an ending diagonal pattern. A bullish confirmation would occur if the price breaches $4.686 with an impulse wave, indicating a strong likelihood of further recovery.
Alternative scenario
Alternatively, the decline on the H4 chart could be interpreted as an impulse wave. If this is the case, the current bullish recovery remains valid. However, we would not see a breach of the $5.192 high before the price resumes its downward movement to break below $4.379. Therefore, in both scenarios, copper prices are expected to maintain their current recovery to at least the $4.69-$4.788 range in the near term.
Summary
Copper has been recovering from the sell-off that started on May 20, 2024, within the context of a larger bullish cycle that began in October 2023. On the daily chart, a bullish impulse wave has been forming since July 2022, with wave 3 of (3) completing at $5.192 and wave 4 of (3) likely concluding at the June 18 low. The price is expected to rise into wave 5, surpassing $5.192 before the next pullback for wave (4). The invalidation level for this wave count is at $3.975.
On the H4 chart, wave 4 is identified as a double zigzag, with wave a (circled) ending in an impulse and wave c (circled) in an ending diagonal. Bullish confirmation would be a break above $4.686 with an impulse wave, signaling further recovery.
Alternatively, if the decline is an impulse wave, the bullish recovery is still valid but without breaching $5.192 before dropping below $4.379. In either scenario, copper prices are likely to continue recovering to the $4.69-$4.788 range in the near term.
Copper Elliott Wave technical analysis [Video]
Author

Peter Mathers
TradingLounge
Peter Mathers started actively trading in 1982. He began his career at Hoei and Shoin, a Japanese futures trading company.


