Copper Elliott Wave technical analysis [Video]
![Copper Elliott Wave technical analysis [Video]](https://editorial.fxstreet.com/images/Markets/Commodities/Metals/Copper/copper-pipes-of-different-diameters-in-a-warehouse-40168634_XtraLarge.jpg)
Copper Elliott Wave analysis - Buy the dip strategy is ideal
Function - Counter-trend.
Mode - Corrective.
Structure - Zigzag.
Position -Blue wave a of black wave Y.
Direction - Blue waves b-c of black wave Y.
Since October 2023, Copper has gained over 8%. Meanwhile, the Elliott wave perspective is looking at this commodity to continue the giant corrective structure it started in March 2022. Copper is expected to resume a strong rally once the current minor dip is subdued by the bullish flow again. But the questions are, where can traders and investors look for opportunities and how strong can the rally from October 2023 go into the future? Let’s dive into our commodity Elliott wave analysis that covers Copper.
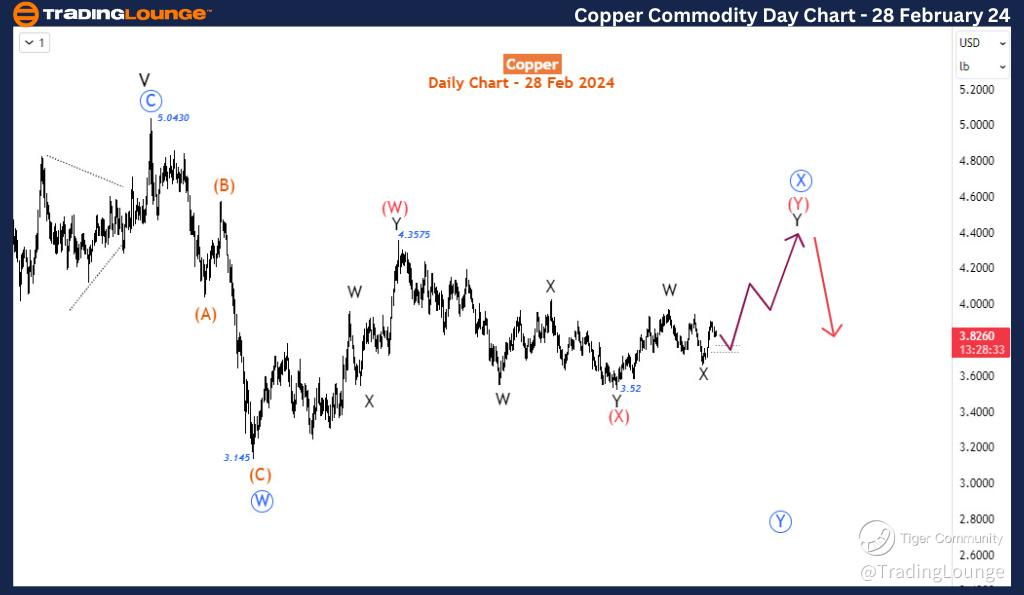
On the daily time frame chart, from March 2022, when the commodity was trading for nearly $5, we could identify the decline to 3.145 (July 2022 - a 38% decline in just 4 months) as a corrective wave. That fall was wild! However, the bullish response has been corrective and has taken over 1.5 years. As a result, we are forecasting a double zigzag blue wave ‘W-X-Y’ from 5.043 top. Wave W ended at 3.145 and wave X is subdividing into red wave (W)-(X)-(Y). Wave (W) closed at 4.3575 and (X) at 4.52 and (Y) is ongoing. Wave (Y), on its own, seems to be subdividing into black wave W-X-Y. We seemed to have completed wave W and X but Y is in the early stage. Thus, with Elliott wave theory, we have identified the position of the current price in the large scope of the last 2 years' price framework. Let’s head to the H4 chart to see where and how we can find a position.
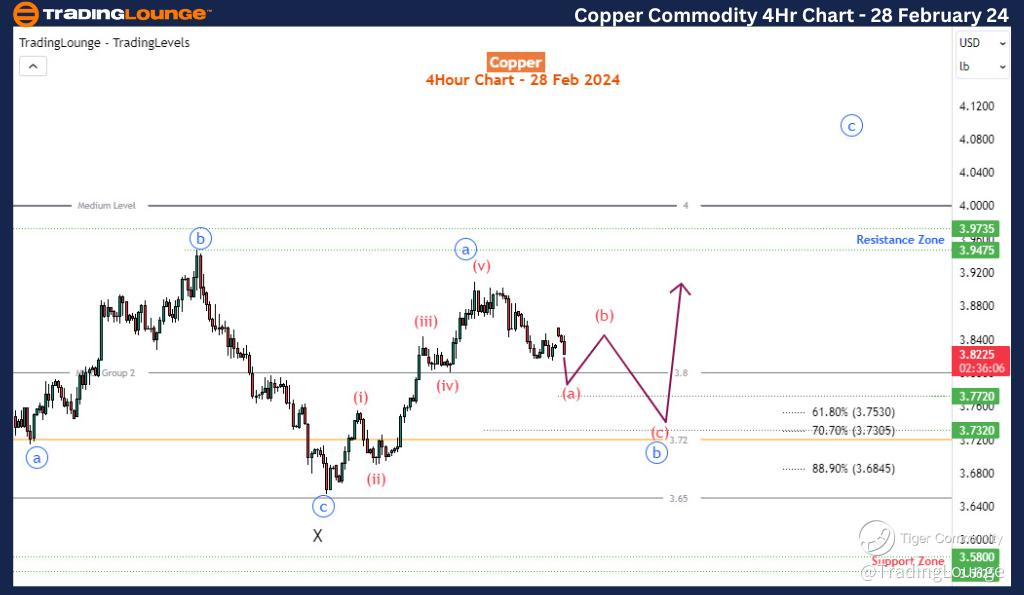
On the H4 time frame chart, after wave X ended, the price advanced in a 5-wave rally. Good response! With the current decline coming out corrective, we will anticipate at least the blue wave ‘a-b-c’ of Y above the 4.00 medium level. Our focus will now be on how blue wave ‘b’ ends. The further decline for red wave (a)-(b)-(c) of blue b could continue to the 3.72 minor level which is also close to the 70.7% retracement of blue wave ‘a’. The setup will be invalid at 3.65 i.e. price below wave X.
In summary, our forecast supports the recovery of Copper to continue further upside. Therefore the current dip is expected to be corrective and stay above 3.65. Buying interest is expected to surge from there.
Copper daily chart
Copper four hour chart
Copper Elliott Wave analysis [Video]
Author

Peter Mathers
TradingLounge
Peter Mathers started actively trading in 1982. He began his career at Hoei and Shoin, a Japanese futures trading company.


