Commodities: Year-end key chart review

Yesterday’s Gold Trading Alerts were very short-term oriented, so – while I provide a quick update as well – today, I’d like to show you several charts that will help you see what’s really going on with the major trends.
Bitcoin Reversal: Has the Tide Turned?
There are quite a lot of them, so let’s start. First off, the individual investor’s darling – bitcoin.
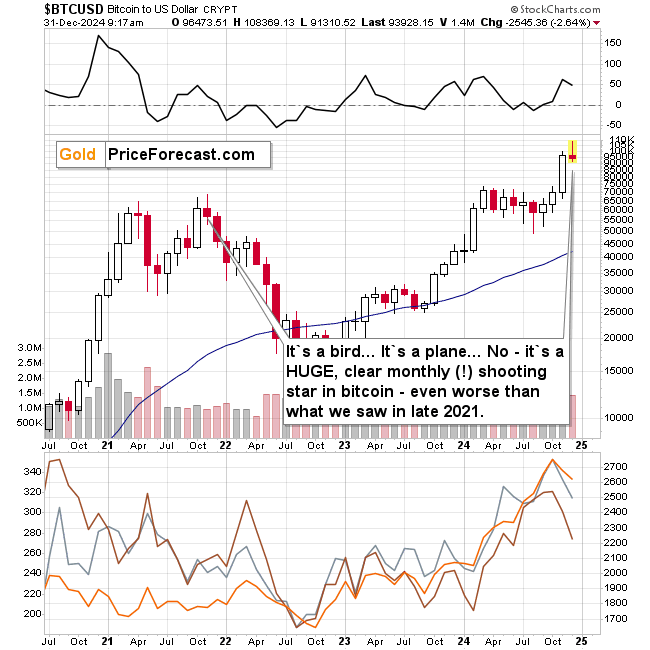
After a sharp run-up and a failed attempt to break above $100k, the “new gold” is forming a monthly shooting star/gravestone doji candlestick. Which one of them is formed is irrelevant as both are reversal candlesticks.
We saw something similar in late 2021, and that was THE top for many months. Has the tide turned for cryptos? That’s quite probable.
Cryptos are connected to part of the commodity world as electricity is used to mine them. And both: copper and silver are great conductors. Silver being the best, and copper being second-best (but much cheaper, which is why it’s used much more often).
Copper is not only after a break a fake breakout above many previous highs, but it’s also after a breakdown below two rising support lines – one based on the 2020 and 2022 lows and the other based on the late-2023 and 2024 lows.
Please note that copper “should have” soared along with stocks as increased industrial demand should have caused its price to rally. No extra demand suggests that maybe not all was right with the strong economic performance.
That’s certainly what the world stocks indicate.
So much money has been created since 2020 and all the world stocks were able to do was to move back to their 2008 highs, then slightly above it and then they failed and moved back below them. It all happened in nominal terms, which means that in real terms, stocks are much cheaper than they were in 2008.
The above-mentioned invalidation is a strong sell sign, which means that stocks are likely to decline, just like copper.
If you look at the lower part of the above chart, you’ll see that the XAU Index – proxy for gold and silver stocks – just invalidated its own move to new highs and above the declining dashed resistance line. When we saw that in 2022, a big decline followed. Given the importance of the invalidation in world stocks, it seems that the following decline in the XAU Index (and other proxies for mining stocks like GDX and GDXJ) will be bigger than what we saw in 2022.
Silver topped at its very long-term cyclical turning point and right at its 61.8% Fibonacci retracement level. This is so perfect from the technical point of view that it might as well be on the book cover of a book on technical analysis.
And now, since silver moved back below $30 and its previous highs, the door to further declines is wide open. Yes, I expect silver to be higher in 1-3 years, but in the meantime, I expect its price to fall, and to fall hard. This is likely to happen given the analogies in other markets that I featured so far – the one to 2008 and 2022 in particular. That’s when silver declined in a substantial manner (and so did mining stocks).
Gold Miners Teeter on the Edge
Speaking of mining stocks, the two key ratios of gold stocks have finally provided us with decisive indications. It’s been months since I previously featured those two ratios as there was little new to report, but this changed recently.
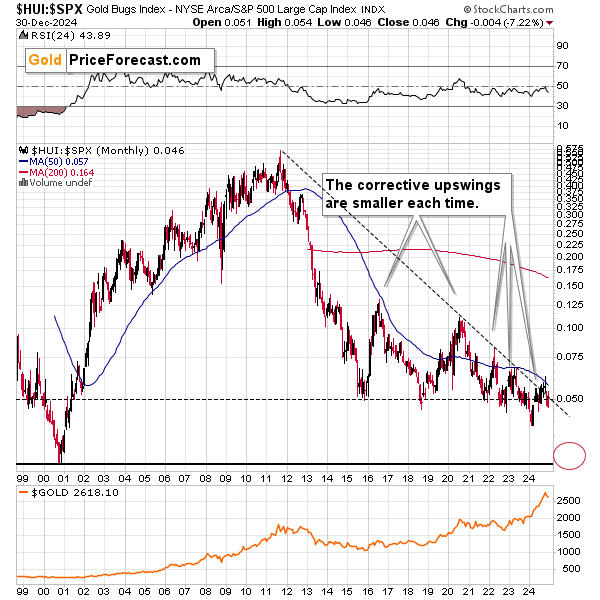
Gold stocks (the HUI Index serves as a proxy here) compared to gold finally topped and resumed their decline. The consolidation took years, so if we see a breakdown below the 2015/2016 lows, the following slide could be spectacular. IF the general stock market declines in a major way (remember the world stock charts? This CAN happen) that’s exactly what could happen to this ratio – and miners’ performance as well.
Gold stocks, relative to other stocks, have just invalidated a small breakout above the declining resistance line, and they just moved below their 2015 low. The previous breakdowns were followed by corrective upswings that each took the ratio to lower highs. It seems that this time – especially given the invalidation of the breakdown – the 2015 low will be broken successfully, leading to much lower values of mining stocks.
What about gold itself?
Well, I don’t want to crush your hopes for new highs in the immediate future, but it doesn’t look like it’s in the cards. Eventually – yes (and some might consider gaining passive income on their gold in the meantime). In the following months? Very unlikely.
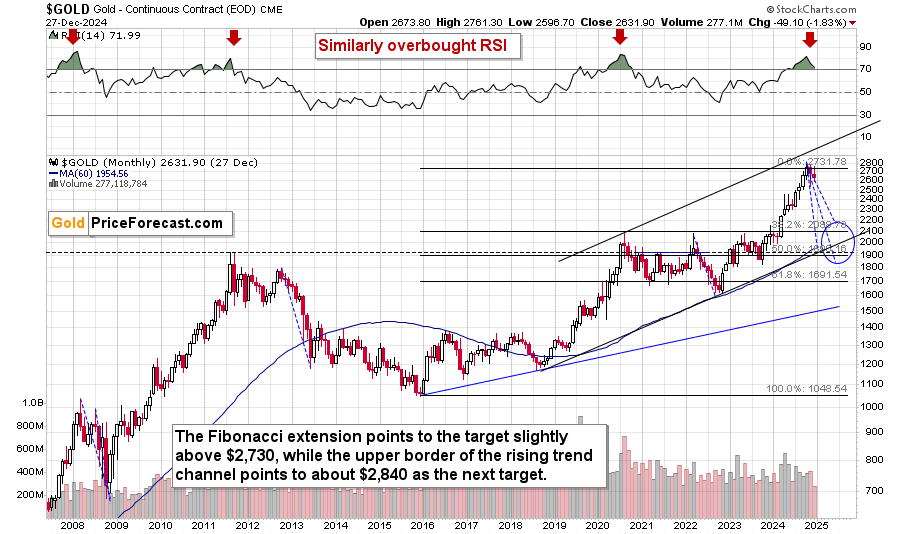
RSI based on monthly candlesticks was just so extremely overbought as it was at the previous very important tops. This is a highly effective indication, so it’s no wonder that gold is already declining. The point here is that based on how lower gold used to decline after such sell signals, it has much more room to fall.
On a side note, please note how perfectly the Fibonacci retracement marked the top for the recent rally in gold – gold peaked just a little above the price levels based on the 1.618 extension of the previous (2015 – 2020) rally. More precisely, it topped between this level and the upper border of the rising trend channel.
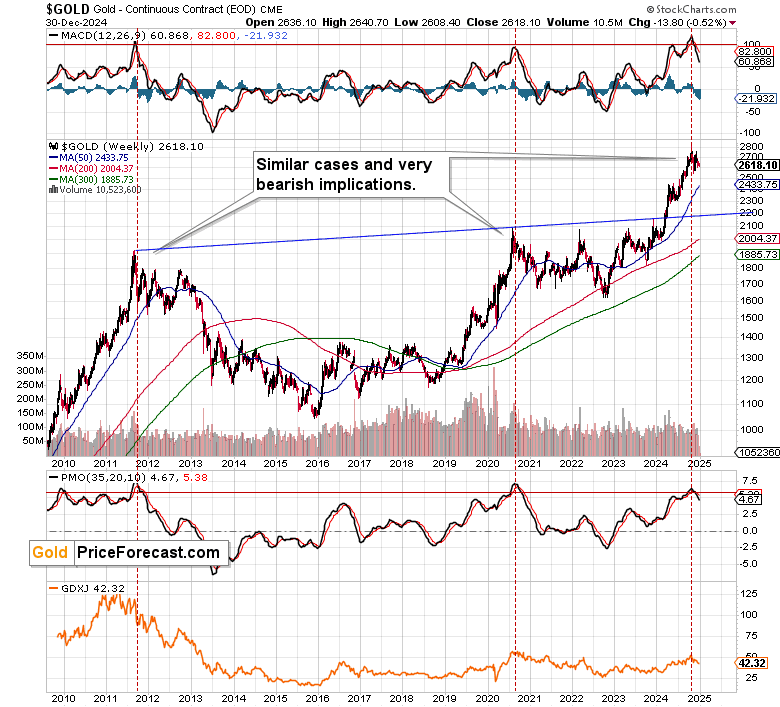
RSI is not the only indicator pointing to much lower gold prices in the following months. The same goes for the MACD and PMO based on gold’s weekly price changes.
As you can see above, the current situation is very similar to what we saw after the 2011 top and after the 2020 top. In both cases, gold, silver, and mining stocks decline for months after those sell signals.
Zooming a bit, do you recall when I wrote about the multi-reversal (a reversal in many parts of the precious metals sector appeared at the same time)? It worked, and the prices have been declining since that time.
The decline has been particularly visible in mining stocks. No wonder – the S&P 500 also declined since that time. The latter didn’t move that much lower, which indicates that when stocks fall in a more meaningful way, miners will likely truly slide.
Zooming even further, we see how the GDXJ moved lower after the consolidation, which itself took place after it broke below its November lows. In other words, the GDXJ appears ripe for another downswing.
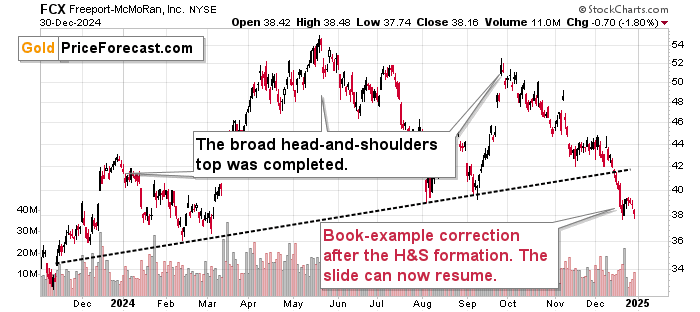
FCX declined yesterday as well, and it looks like the decline is gaining speed – and my subscribers’ profits on this stock (the same with the other that I’m not featuring publicly) are accelerating.
So, the question is – will we see the bottom and a reversal today? It’s not clear if it’s going to happen today, but I continue to expect it to happen in a matter of days.
That’s gold’s 4-hour chart. It shows that gold is on the verge of a short-term breakdown. Once it breaks lower, it could trigger a sizable short-term slide that could, in turn, push miners to our profit-take level.
I wrote about the USD Index’s target at about 108.8 yesterday, and the current intraday cup-and-handle pattern supports another move up, so the above remains up-to-date.
Will the USD Index soar today? Or very early next year?
Perhaps Wall Street is waiting for the year to close so before they pull the triggers and sell their stocks based on how overvalued they are? You know, so that they can cash in their yearly performance-based bonuses first.
Either way, the technicals point to massive declines in the upcoming months, and as far as the short-term is concerned, it seems that we’ll get another move up in the USDX and another move down in the precious metals sector shortly. Then a corrective upswing, and an even bigger slide.
Want free follow-ups to the above article and details not available to 99%+ investors? Sign up to our free newsletter today!
Author

Przemyslaw Radomski, CFA
Sunshine Profits
Przemyslaw Radomski, CFA (PR) is a precious metals investor and analyst who takes advantage of the emotionality on the markets, and invites you to do the same. His company, Sunshine Profits, publishes analytical software that any


