Commodities Weekly: Gold slides as trade deal hopes rise

Hopes that the US-China Phase 1 trade deal will be concluded soon has lifted risk appetite, pressured safe haven assets and boosted crude oil. The agricultural sector is mixed but remains supported.
Precious metals
GOLD has fallen for the past five sessions on trade deal optimism. Trade deal hopes were given a recent boost after China announced it was stepping up efforts to police intellectual property (IP) theft with tougher and higher penalties. IP theft has been a constant sticking point in the negotiations.
Speculative investors are still maintaining a bullish bias however, being net buyers of the precious metal for the fourth time in five weeks to November 19, the latest data from CFTC show. Net longs are now at the highest in two months.
Gold is continuing the theme of lower highs and lower lows within a downward-trending channel since early-September. The base of the channel is around the 1,435 level today. The metal has kept below the 55-day moving average since November 5.
Gold Daily Chart
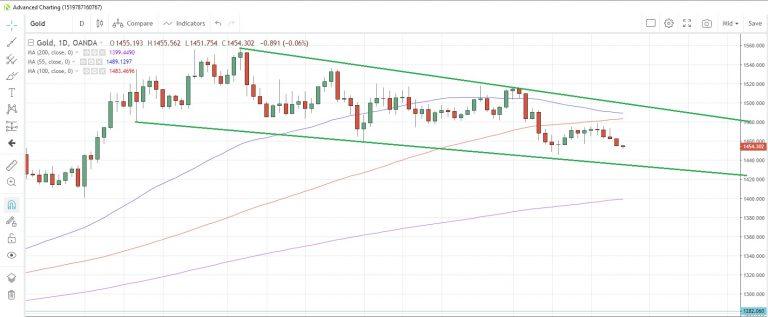
Source: OANDA fxTrade
SILVER likewise has been trending lower over the past week and remains capped by the 100-day moving average, which is at 17.3032 today. The gold/silver (Mint) ratio has been steady for the past two weeks and has been capped at the 87.00 level during that time. It’s now at 86.266.
Silver’s losses come despite market expectations that the global surplus would shrink for a second consecutive year this year. Speculative investors brought a two-week net short selling spree to a halt in the week to November 19, according to CFTC data.
PLATINUM fell the most in almost two months on Friday after the World Platinum Investment Council released a report late Thursday warning that the metal could face challenges next year, with demand expected to drop 10% on the back of waning investment flows and slower industrial demand.
The fall brought platinum to the lowest in a week, and it closed below the 100-day moving average for the first time since November 14.
PALLADIUM is extending its rebound from the one-month lows below 1,700 seen earlier this month, and reached the highest since November 4 yesterday. The 55-day moving average support remains intact, as it has been since August 30. Speculative investors appear to be using the recent rally to offload some long positions, having reduced net long positions for a third consecutive week in the week to November 19, according to the latest data from CFTC. Net long positioning is now at its lowest since the week of August 27.
According to data released by Swiss customs, the country’s palladium exports hit a five-year high in October as a result of heavy demand from Hong Kong.
Base metals
COPPER is little changed this week as investors digest the latest news on the US-China trade negotiations. The industrial metal appears to be holding above the 55- and 100-day moving averages at 2.626 and 2.624, respectively, despite attempts last week to test the downside.
Speculative investors remain skeptical about the prospects for a trade deal after increasing net short positions for a second week in the week to November 19. Net shorts are now at the highest since the week of October 22.
Investment bank Goldman Sachs sees a 3.5% pickup in China’s copper demand next year compared to a 0.5% increase this year. It attributes the increased demand to a pickup in property and grid investment, according to a Bloomberg report yesterday. Copper stocks at warehouses monitored by the London Metal Exchange (LME) plunged the most since October 23 last Friday.
Copper Daily Chart
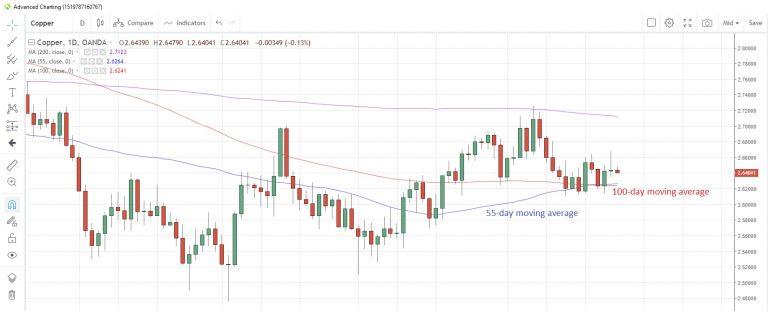
Source: OANDA fxTrade
Energy
CRUDE OIL prices rose toward the end of last week and West Texas Intermediate (WTI) touched the highest since September 23 on Friday. Expectations are still high that OPEC and its allies will extend the current production caps at the December 5-6 meeting, though doubts exist that deeper cuts will be announced. Certainly Russia has dragged its heels when considering cutting production.
China’s apparent crude oil demand rose 7.3% in October from a year earlier to just above 13 million barrels per day (bpd), according to Bloomberg calculations based on data from China’s Customs General Administration. The number of US oil rigs in production fell for a fifth straight week last week and are now at the lowest since end-March 2017.
Speculative investors were net buyers of the commodity for a sixth consecutive week in the week to November 19. Net long positioning is now at its highest since the week of May 28, according to the latest report from CFTC.
NATURAL GAS suffered the biggest daily loss in a week yesterday, erasing all the gains of the previous three days in one hit. Prices remain above the 55-day moving average at 2.4637, which has supported prices since October 28. That average could hold in the near term as a cold front is forecast across the western half of the US in the November 30 to December 4 period, which could boost demand for natural gas.
However, Goldman Sachs sees the current bearish natural gas cycle lasting through 2020 on ample supply, according to a research note published yesterday. Speculative investors seem to agree, increasing net short positions for the first time in four weeks, according to the latest CFTC data.
Agriculturals
WHEAT prices jumped the most since October 11 yesterday after a few news headlines raised questions about future supply. First off, Russia announced that its 2019/20 wheat crop would be lower at 75 million tons compared with 78 million tons at a prior estimate. Meanwhile data showed fewer acres of winter wheat were planted in the US while Australia’s production is expected to the trimmed.
China’s imports in October were up 24.5% from a year earlier but on a year-to-date basis are 6.9% lower at 2.54 million tons. Speculative investors were well positioned for the latest jump, having increased net long positions for a second week to November 19.
SUGAR prices also spiked higher yesterday to levels not seen since July 11. The upmove means that sugar could be on track for its sixth weekly gain in a row and appears to now have a strong foothold above the 55- and 100-week moving averages at 0.1205 and 0.1204 respectively.
China’s sugar imports in October rose 36.7% y/y to 450,000 tons, according to data from China’s General Administration of Customs reported Saturday. Speculative accounts reduced net short positions in the week to November 19, according to CFTC, and they are now at the least since mid-August.
Sugar Weekly Chart

Source: OANDA fxTrade
China’s CORN imports came to 90,000 tons in October, a 12.8% increase from a year earlier, according to customs data. If corn prices hold current levels, they could be on track for the first weekly gain in four weeks.
SOYBEANS prices are edging toward the 55-week moving average at 8.8248 as they face a potential fourth weekly loss in a row. Speculative investors scaled back net long positions for a third week to November 19 and they are now at the lowest since the week of October 8, CFTC data show.
Author

Andrew Robinson
MarketPulse
A seasoned professional with more than 30 years’ experience in foreign exchange, interest rates and commodities, Andrew Robinson is a senior market analyst with OANDA, responsible for providing timely and relevant market commentar


