Coffee Elliott Wave technical analysis [Video]
![Coffee Elliott Wave technical analysis [Video]](https://editorial.fxstreet.com/images/Markets/Commodities/Agriculture/Coffee/coffee-beans-background-46166242_XtraLarge.jpg)
Coffee Elliott Wave analysis
Coffee is trading lower in the second half of October 2024 after completing a corrective bounce in the 2nd week. However, while the long-term Elliott wave forecast expects the commodity to resume the bullish cycles from October 2001 and a more recent one in June 2019, the short-term to medium-term pullback will most likely continue to the lows of August/September 2024.
The long-term bullish corrective cycle started in May 2019. Aside from triangles, corrective structures are often subdivided into 3-waves. The first wave ended in February 2022 - cycle degree wave w. A pullback for the cycle degree wave x followed and ended in January 2023. From there, the cycle degree wave y began.
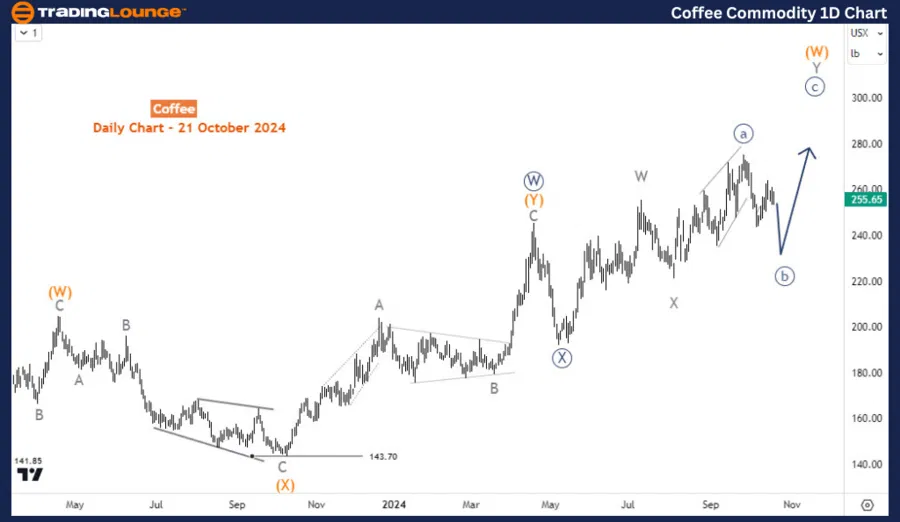
Daily chart analysis
The daily chart captures the wave development of the cycle degree wave y - subdivided into wave ((W))-((X))-((Y)). Wave ((W)) and ((X)) ended already and price is in ((Y)). Along ((Y)), the price is currently in a pullback for ((b)) of Y of (W) of ((Y)). This summarizes that the upside is still favored for Coffee and prices should make fresh rallies from pullbacks of different degrees.
Four-hour chart analysis
On the H4 chart, the pullback from the $275 Sept-2024 high should continue lower for wave (c) of ((b)) where it could find support within the 223.85-216.80 Fibonacci zone. At this zone, wave ((c)) could begin upside to complete wave (W) of ((Y)).
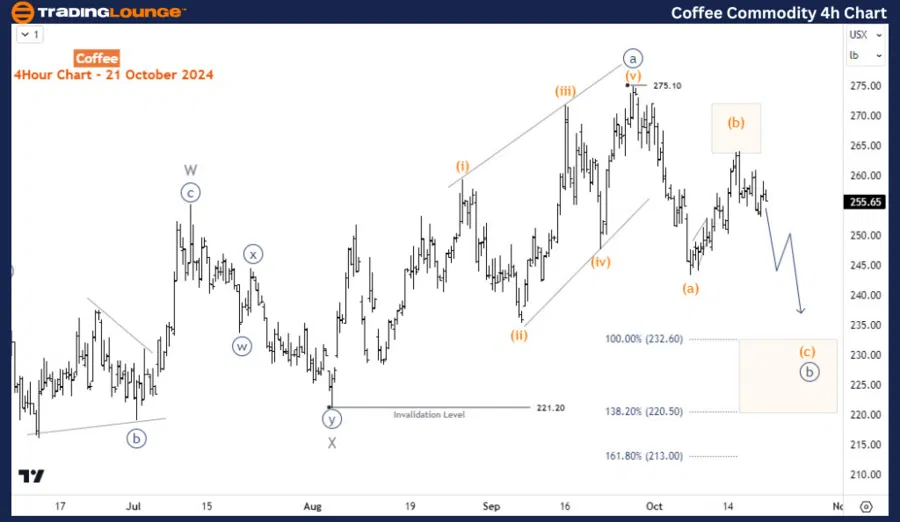
Thus, while the pullback from $275 may process lower in the short term, the larger bullish trend should resume and that’s what traders should focus on.
Coffee Elliott Wave technical analysis [Video]
Author

Peter Mathers
TradingLounge
Peter Mathers started actively trading in 1982. He began his career at Hoei and Shoin, a Japanese futures trading company.


