Coffee Elliott Wave analysis 

Function - Counter-Trend.

Mode - Correction.

Structure - Double zigzag for wave W (circled).

Position - Wave (Y) of W.

Direction - Wave (Y) of W is still in progress.

Details - The commodity still favors the upside to complete wave C of (W) before turning downside in wave X (circled) pullback.

Copper is currently in a retracement phase after reaching a fresh peak for 2024. The commodity has been on a strong bullish run since January 2023, following an 11-month pullback that began in February 2022. In the near to medium term, Copper is likely to hit another high before undergoing a more substantial pullback.

Long-term chart analysis

Copper has historically exhibited range-bound movements. The lower boundary ranges between $40 and $55, while the upper boundary ranges between $276 and $337. The current bullish phase began in May 2019 and completed its first phase in February 2022. The second phase, a pullback from the February 2022 peak, concluded in January 2023. The third and current bullish phase started in January 2023 and is expected to evolve in a corrective structure.

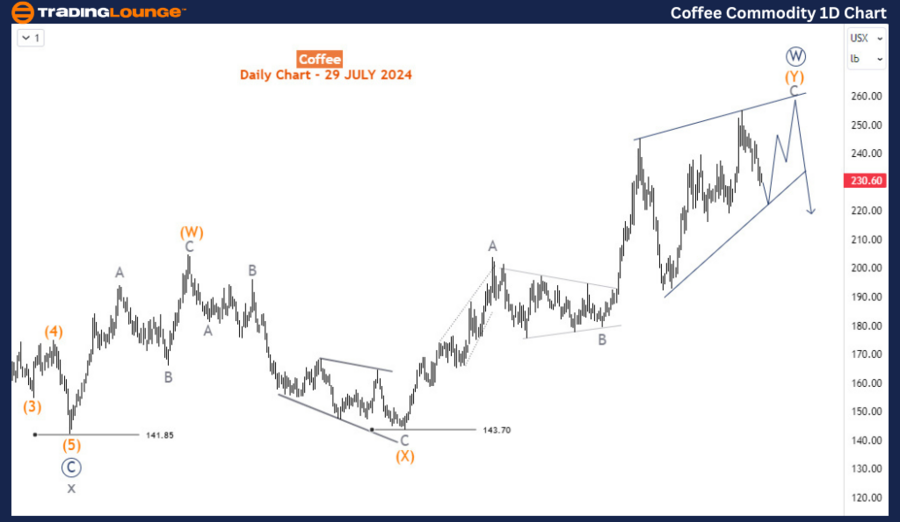
Daily chart analysis

On the daily chart, the third phase of the recovery completed its first leg, wave (W), in April 2023 before transitioning into another 3-wave structure for wave (X), which ended at 143.70 in October 2023. The current surge is anticipated to complete wave (Y) of the primary degree wave W (circled). Following this, a larger pullback for wave X (circled) is expected. Currently, wave (Y) is still in progress, with price in wave C of (Y), which is forming an ending diagonal structure.
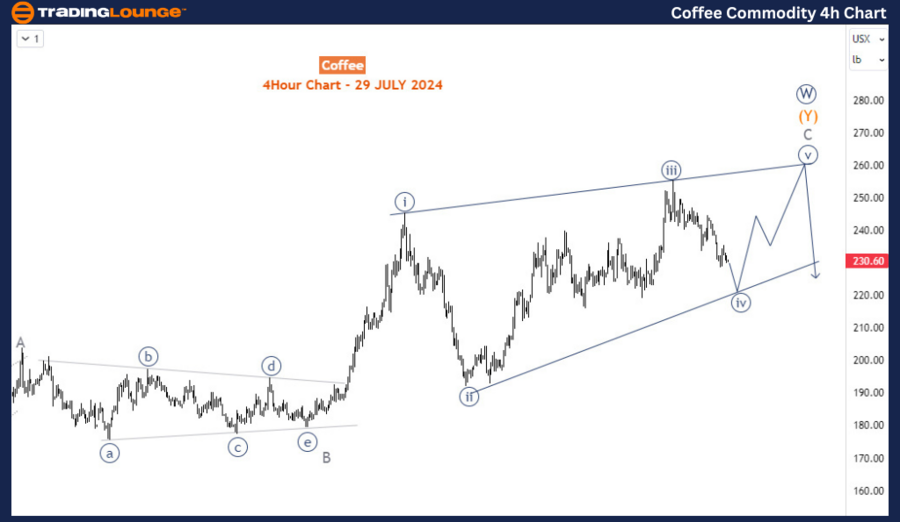
Chart


H4 chart analysis

On the H4 chart, the ending diagonal for wave C is in its fourth wave, wave iv (circled). One more rally is anticipated to complete wave v (circled) within the diagonal. After this rally, a significant pullback is expected to occur, forming another corrective structure.

Chart


Summary

In summary, the Elliott Wave analysis for Copper suggests that after the current retracement, the commodity is likely to see another high before a more substantial pullback ensues. Key levels to watch include the completion of wave v (circled) on the H4 chart and the subsequent larger pullback. 

Technical analyst: Sanmi Adeagbo.

Coffee Elliott Wave analysis [Video]

As with any investment opportunity there is a risk of making losses on investments that Trading Lounge expresses opinions on.

Historical results are no guarantee of future returns. Some investments are inherently riskier than others. At worst, you could lose your entire investment. TradingLounge™ uses a range of technical analysis tools, software and basic fundamental analysis as well as economic forecasts aimed at minimizing the potential for loss.

The advice we provide through our TradingLounge™ websites and our TradingLounge™ Membership has been prepared without considering your objectives, financial situation or needs. Reliance on such advice, information or data is at your own risk. The decision to trade and the method of trading is for you alone to decide. This information is of a general nature only, so you should, before acting upon any of the information or advice provided by us, consider the appropriateness of the advice considering your own objectives, financial situation or needs. Therefore, you should consult your financial advisor or accountant to determine whether trading in securities and derivatives products is appropriate for you considering your financial circumstances.

Recommended Content


Recommended Content

Editors’ Picks

EUR/USD tuns south toward 1.0800 amid US Dollar rebound

EUR/USD tuns south toward 1.0800 amid US Dollar rebound

EUR/USD has turned back in negative territory, eyeing 1.0800 in the European session on Monday. The US Dollar stages a decent comeback, as risk sentiment sours amid Middle East tensions and the markets' nervousness ahead of a critical central banks' week. 

EUR/USD News

GBP/USD tumbles to test 1.2800 as US Dollar finds fresh demand

GBP/USD tumbles to test 1.2800 as US Dollar finds fresh demand

GBP/USD has come under decent selling pressure, testing 1.2800 in European trading on Monday. The pair is hit by resurgent US Dollar demand, as risk sentiment dwindles, with traders turning cautious ahead of the key Fed and BoE policy decisions due later in the week. 

GBP/USD News

Gold price recovery stalls near $2,400

Gold price recovery stalls near $2,400

Gold price is defending minor bids in the European session on Monday, having faced rejection above $2,400. Gold price meets renewed selling pressure from a broad US Dollar upswing but the downside appears cushioned amid escalating Middle East tensions. 

Gold News

Ripple update: What to expect from XRP and Ripple lawsuit this week

Ripple update: What to expect from XRP and Ripple lawsuit this week

Ripple (XRP) extended gains by nearly 2% early on Sunday. XRP sustained above the psychological price level of $0.60 amidst the optimism of Donald Trump’s speech at the Bitcoin conference, and BTC’s recent gains. 

Read more

Seven fundamentals for the week: Fed, NFP, geopolitics and lots of data promise an explosive week Premium

Seven fundamentals for the week: Fed, NFP, geopolitics and lots of data promise an explosive week

Time for a summer holiday? Not yet, as this week promises to be super hot in financial markets. Three central bank decisions and US jobs data – which is growing in importance as inflation fades – provide a jam-packed schedule. 

Read more

Majors

Cryptocurrencies

Signatures