Coffee Elliott Wave technical analysis [Video]
![Coffee Elliott Wave technical analysis [Video]](https://editorial.fxstreet.com/images/Markets/Commodities/Agriculture/Coffee/coffee-beans-background-46166242_XtraLarge.jpg)
Coffee Elliott Wave technical analysis
Function - Counter-Trend.
Mode - Correction.
Structure - Double zigzag for wave Y (circled).
Position - Wave C of (W).
Direction - Wave C is still in progress.
Details - The commodity still favors the upside to complete wave C of (W) toward 261.35-278.5 where another pullback may begin.
The recent developments in the copper market suggest a continuation of the bullish trend that began in January 2023. Since resuming this bullish sequence on May 6, 2024, copper has closed every month from March 2024 in the green and appears set to do the same in July. The coming months could see copper prices surpass the February 2022 high, reaching levels not seen since September 2011.
Long-term structure analysis
The long-term structure indicates that copper completed a bearish cycle between May 2011 and May 2019. The recovery starting from May 2019 could complete either an impulse wave or another corrective structure. Projections suggest that copper prices should reach $315, which is over 32% higher than the current price. The ongoing recovery saw its 1st and 2nd legs complete in May 2022 and February 2022 and January 2023, respectively, labeled as wave x-y of the cycle degree. The current leg is considered wave x of the cycle degree, with a target of $315.
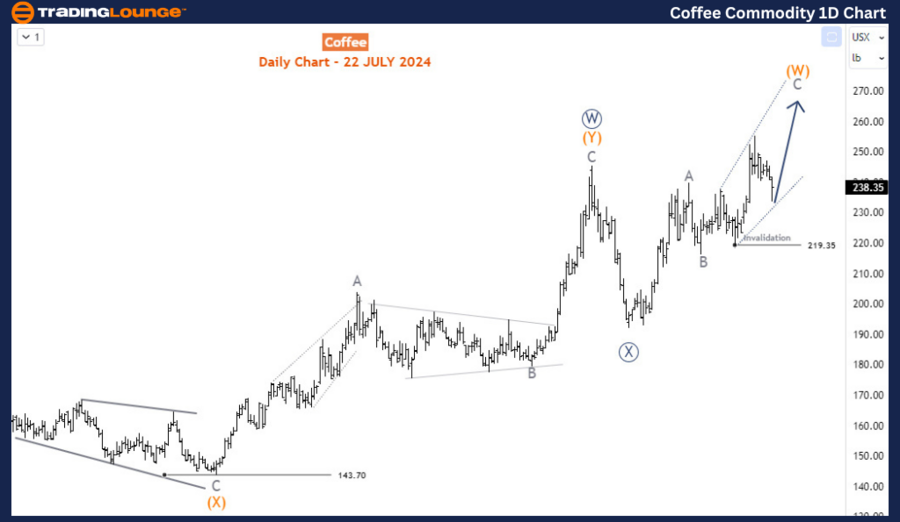
Daily chart analysis
On the daily chart, it is observed that wave x (cycle degree) might complete a W-X-Y (circled) pattern of the primary degree. Waves W and X have already been completed, and the price is currently advancing in wave Y (circled). Wave Y could also develop into a three-wave structure, indicating that the price is presently in wave C of (W) of Y (circled). Wave C of (W) is evolving into an expanding diagonal structure, reflecting the bullish momentum.
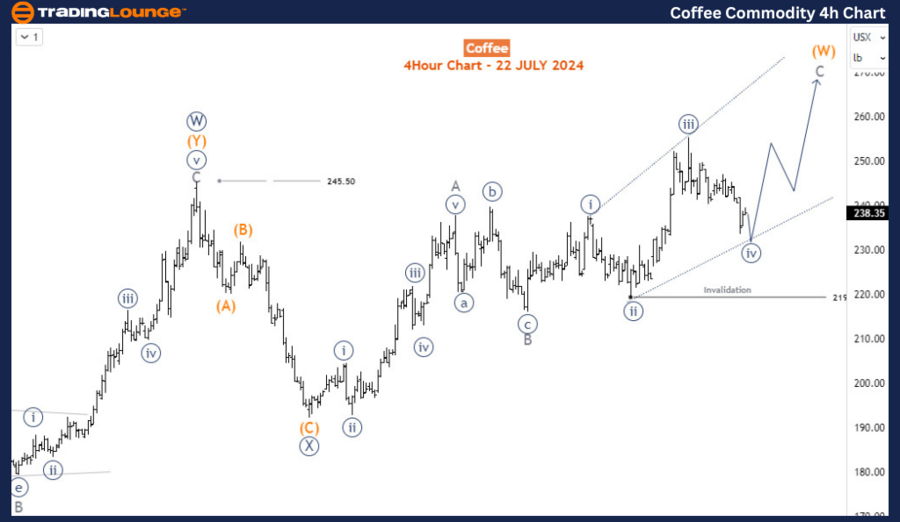
Four-hour chart analysis
The H4 chart shows that wave C is nearing the completion of its 4th sub-wave. As long as support is maintained above 219.35, an extension higher to the 260-270 range is expected, completing wave (W) before the next pullback for wave (X) begins. This support level is crucial for maintaining the bullish outlook and achieving the projected targets.
Summary
In summary, the Elliott Wave analysis suggests that copper is in the midst of a robust bullish trend, with the potential to reach $315 in the near term. Key levels to watch include the support at 219.35 and the target range of 260-270 for the completion of wave (W). The long-term structure and current wave patterns indicate a continuation of the upward momentum, providing valuable insights for both short-term and long-term trading strategies. This analysis underscores the importance of closely monitoring wave structures and key price levels to anticipate future movements in the copper market.
Coffee Elliott Wave technical analysis [Video]
Author

Peter Mathers
TradingLounge
Peter Mathers started actively trading in 1982. He began his career at Hoei and Shoin, a Japanese futures trading company.


