|

Cocoa Elliott Wave technical analysis [Video]

Cocoa Elliott Wave analysis

After hitting a fresh record high in December 2024, Cocoa prices started correcting the resurgence from the October low. It appears the pullback from the record high is completed or very close to finishing. Thus, the commodity could be ready to smash the previous high for a new one.

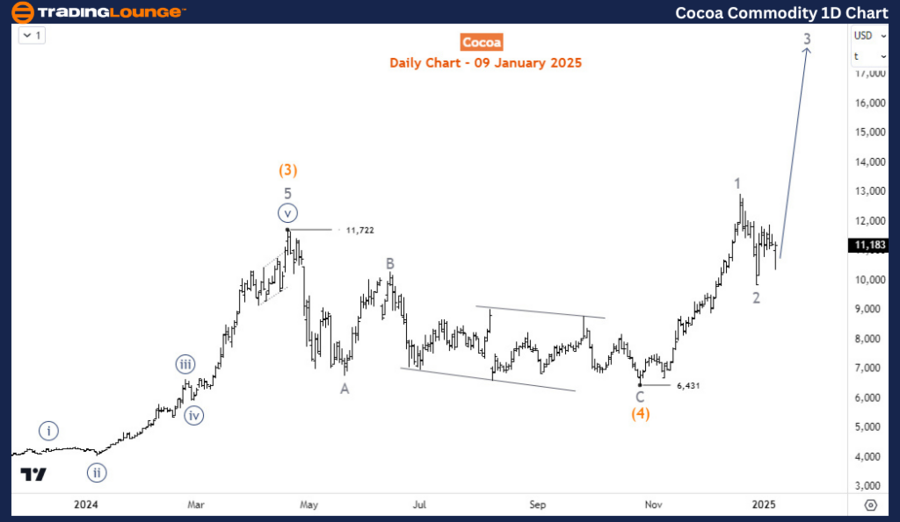
Cocoa daily chart analysis

After finishing an all-time bearish cycle at $708 in December 2000, Cocoa prices have not looked back. The commodity has emerged in a clear bullish impulse structure from that low. it finished wave I at 3775 in February 2011 and then pullback in wave II in April 2017 at 1756 before it surged along the path of wave III. It breached the 3775 previous record high to another record high at 11722 in April 2024 to finish the wave (3) of ((3)) of III. The wave (4) pullback that followed ended with a zigzag structure at 6425 in October 2024 from where the current resurgence started, as shown on the daily chart. Upside remains favored for cocoa as buyers wait to buy from pullbacks to new highs.

Cocoa

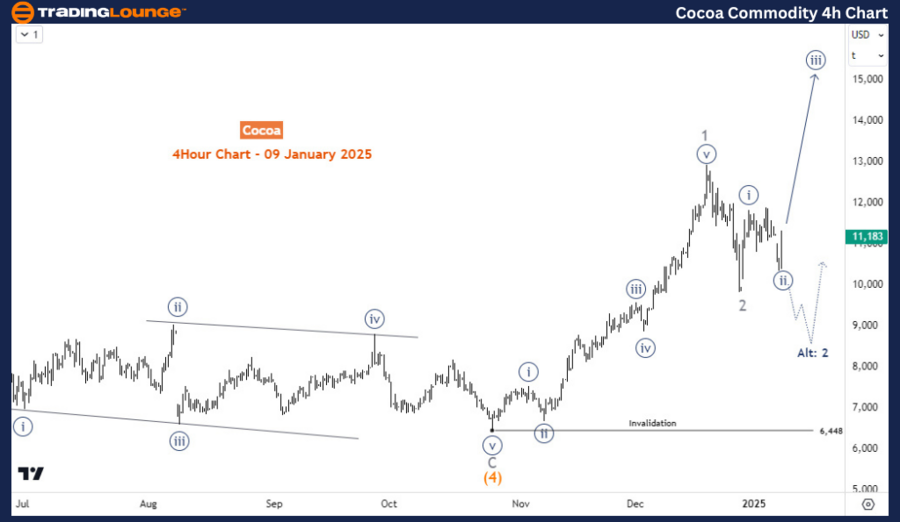
Cocoa four-hour chart analysis

The H4 chart shows that the price has finished a 5-wave rally for wave 1 of (5). The pullback from December is now for wave 2. If the price reclaims the wave 1 high, then wave 3 will progress toward 20,000. However, wave 2 can complete a double zigzag to 8742-6795 before returning upside in wave 3. Provided 625 is not breached, cocoa prices should return for a new fresh high.

Cocoa

Cocoa Elliott Wave technical analysis [Video]

Author

Peter Mathers

Peter Mathers

TradingLounge

Peter Mathers started actively trading in 1982. He began his career at Hoei and Shoin, a Japanese futures trading company.

More from Peter Mathers
Share:

Editor's Picks

EUR/USD hits two-day highs near 1.1820

EUR/USD picks up pace and reaches two-day tops around 1.1820 at the end of the week. The pair’s move higher comes on the back of renewed weakness in the US Dollar amid growing talk that the Fed could deliver an interest rate cut as early as March. On the docket, the flash US Consumer Sentiment improves to 57.3 in February.

GBP/USD reclaims 1.3600 and above

GBP/USD reverses two straight days of losses, surpassing the key 1.3600 yardstick on Friday. Cable’s rebound comes as the Greenback slips away from two-week highs in response to some profit-taking mood and speculation of Fed rate cuts. In addition, hawkish comments from the BoE’s Pill are also collaborating with the quid’s improvement.

Gold climbs further, focus is back to 45,000

Gold regains upside traction and surpasses the $4,900 mark per troy ounce at the end of the week, shifting its attention to the critical $5,000 region. The move reflects a shift in risk sentiment, driving flows back towards traditional safe haven assets and supporting the yellow metal.

Crypto Today: Bitcoin, Ethereum, XRP rebound amid risk-off, $2.6 billion liquidation wave

Bitcoin edges up above $65,000 at the time of writing on Friday, as dust from the recent macro-triggered sell-off settles. The leading altcoin, Ethereum, hovers above $1,900, but resistance at $2,000 caps the upside. Meanwhile, Ripple has recorded the largest intraday jump among the three assets, up over 10% to $1.35.

Three scenarios for Japanese Yen ahead of snap election

The latest polls point to a dominant win for the ruling bloc at the upcoming Japanese snap election. The larger Sanae Takaichi’s mandate, the more investors fear faster implementation of tax cuts and spending plans. 

XRP rally extends as modest ETF inflows support recovery

Ripple is accelerating its recovery, trading above $1.36 at the time of writing on Friday, as investors adjust their positions following a turbulent week in the broader crypto market. The remittance token is up over 21% from its intraday low of $1.12.