|

Cocoa Elliott Wave technical analysis [Video]

Cocoa Elliott Wave analysis

Cocoa continues to build on the recovery from late October against the April 2024 record high. While the recovery should continue higher, traders shouldn't write off further decline.

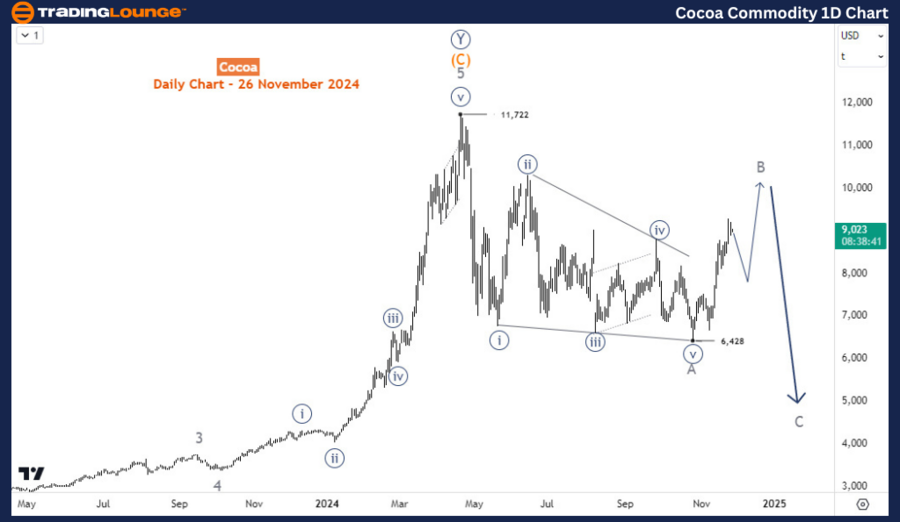
Daily chart analysis

From October 2022, cocoa prices rallied in a 5-wave impulse structure from 2198 to a record high of 11,722 in April 2024. From the Elliott wave perspective, a 3-wave correction follows a 5-wave trend in the opposite direction. After the 11722 peak, prices have plunged from April 2024 to October 2024 at 6428. Meanwhile, this decline completed a diagonal structure identified as wave A of the entire correction from 11722. This means traders can anticipate a 5-3-5 zigzag structure. Thus, the current bounce should be wave B emerging into a corrective structure. However, it appears wave B has not yet finished. Following the end of wave B should be another decline for wave C below 6428 toward 5,000. Meanwhile, it’s important to note this forecast for wave C will be valid if the bounce from 6428 completes a corrective structure below 11722.

Chart

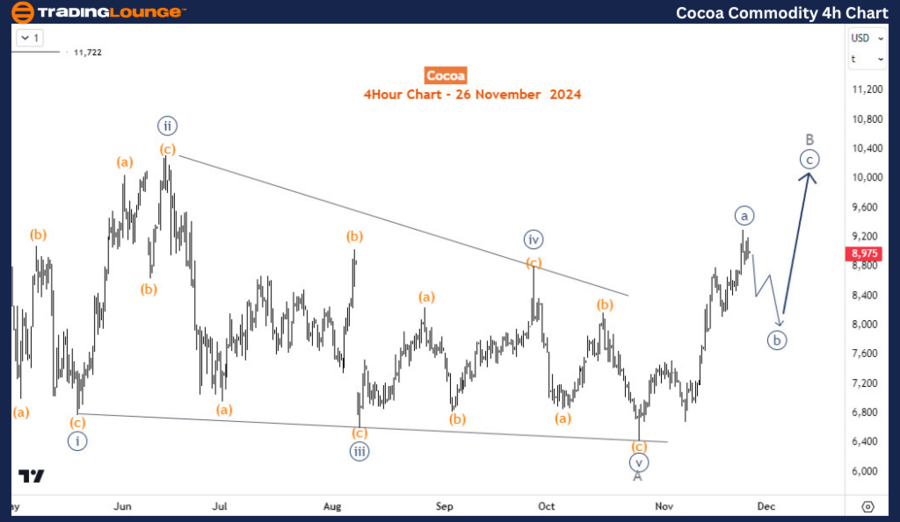
Four-hour chart analysis

The H4 chart shows the price in wave ((a)) of B. Wave ((a)) is close to completion and should be followed by wave ((b)) correction soon. Meanwhile, one more leg higher should happen for eave ((c)) of B before the decline from 11722 continues lower for wave C.

Cocoa

Cocoa Elliott Wave technical analysis [Video]

Author

Peter Mathers

Peter Mathers

TradingLounge

Peter Mathers started actively trading in 1982. He began his career at Hoei and Shoin, a Japanese futures trading company.

More from Peter Mathers
Share:

Editor's Picks

EUR/USD hits two-day highs near 1.1820

EUR/USD picks up pace and reaches two-day tops around 1.1820 at the end of the week. The pair’s move higher comes on the back of renewed weakness in the US Dollar amid growing talk that the Fed could deliver an interest rate cut as early as March. On the docket, the flash US Consumer Sentiment improves to 57.3 in February.

GBP/USD reclaims 1.3600 and above

GBP/USD reverses two straight days of losses, surpassing the key 1.3600 yardstick on Friday. Cable’s rebound comes as the Greenback slips away from two-week highs in response to some profit-taking mood and speculation of Fed rate cuts. In addition, hawkish comments from the BoE’s Pill are also collaborating with the quid’s improvement.

Gold climbs further, focus is back to 45,000

Gold regains upside traction and surpasses the $4,900 mark per troy ounce at the end of the week, shifting its attention to the critical $5,000 region. The move reflects a shift in risk sentiment, driving flows back towards traditional safe haven assets and supporting the yellow metal.

Crypto Today: Bitcoin, Ethereum, XRP rebound amid risk-off, $2.6 billion liquidation wave

Bitcoin edges up above $65,000 at the time of writing on Friday, as dust from the recent macro-triggered sell-off settles. The leading altcoin, Ethereum, hovers above $1,900, but resistance at $2,000 caps the upside. Meanwhile, Ripple has recorded the largest intraday jump among the three assets, up over 10% to $1.35.

Three scenarios for Japanese Yen ahead of snap election

The latest polls point to a dominant win for the ruling bloc at the upcoming Japanese snap election. The larger Sanae Takaichi’s mandate, the more investors fear faster implementation of tax cuts and spending plans. 

XRP rally extends as modest ETF inflows support recovery

Ripple is accelerating its recovery, trading above $1.36 at the time of writing on Friday, as investors adjust their positions following a turbulent week in the broader crypto market. The remittance token is up over 21% from its intraday low of $1.12.