Cocoa Elliott Wave technical analysis [Video]
![Cocoa Elliott Wave technical analysis [Video]](https://editorial.fxstreet.com/images/Markets/Commodities/Agriculture/cocoa3-637443210162219163_XtraLarge.jpg)
Cocoa Elliott Wave analysis
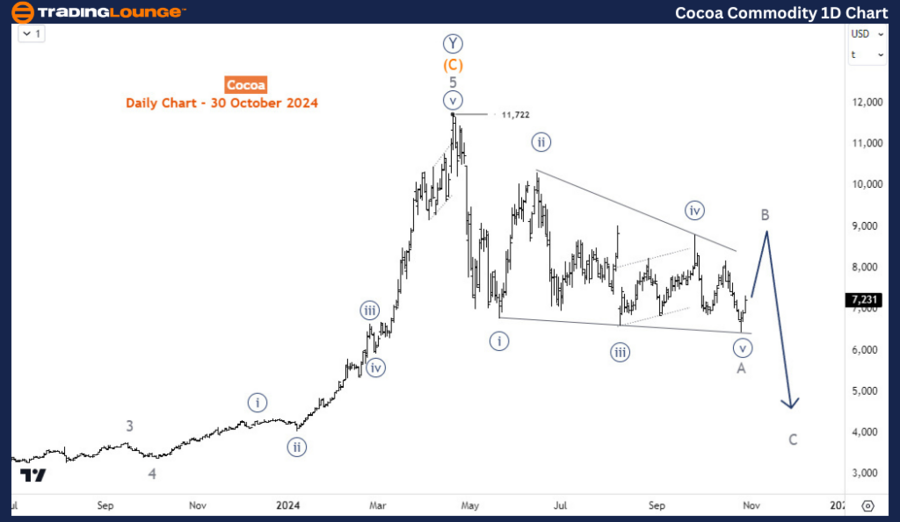
After reaching an all-time high of 11,722 in April 2024, cocoa has shed over 40% in the last six months. The market was expected to correct after such an extended rally that lasted between November 2022 and April 2024. What structure is emerging for the corrective phase and how much deeper could it extend?
Daily chart analysis
According to the Elliott wave theory, corrections evolve in a 3-wave structure aside from triangles hat sub-divide into 5 different 3-wave sub-structures. The decline from 11,722 has completed a leading diagonal structure. We identify this as wave A. Thus, the current bounce is expected to extend higher in any of the corrective structures before the price returns lower in wave C. With this outlook, the entire corrective phase from 11,722 should reach at least 5000 before the long-term trend resumes upside.
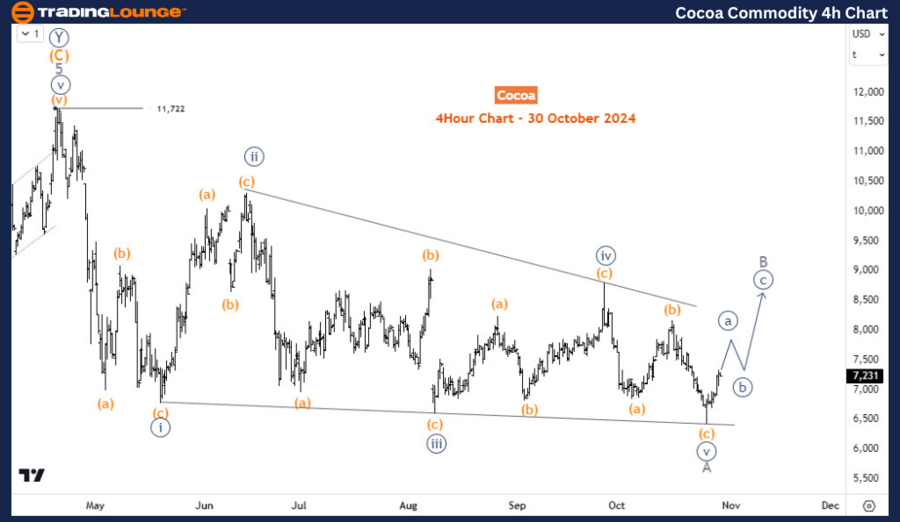
Four-hour chart analysis
On the H4 chart, wave B is expected to bounce in at least 3-wave of a zigzag, flat, or 5-wave triangle. It’s still early to call what pattern will emerge for B. Meanwhile, if it completes a clear corrective structure, sellers should be more confident in lowering prices in wave C toward 5000.
Cocoa Elliott Wave technical analysis [Video]
Author

Peter Mathers
TradingLounge
Peter Mathers started actively trading in 1982. He began his career at Hoei and Shoin, a Japanese futures trading company.


