Cocoa Elliott Wave technical analysis [Video]
![Cocoa Elliott Wave technical analysis [Video]](https://editorial.fxstreet.com/images/Markets/Commodities/Agriculture/cocoa2-637443210151750324_XtraLarge.jpg)
Cocoa Elliott Wave analysis
Function - Counter-trend.
Mode - Corrective.
Structure - Double Zigzag.
Position - Navy blue wave ‘c’.
Direction - Navy blue wave ‘c’ is still in play.
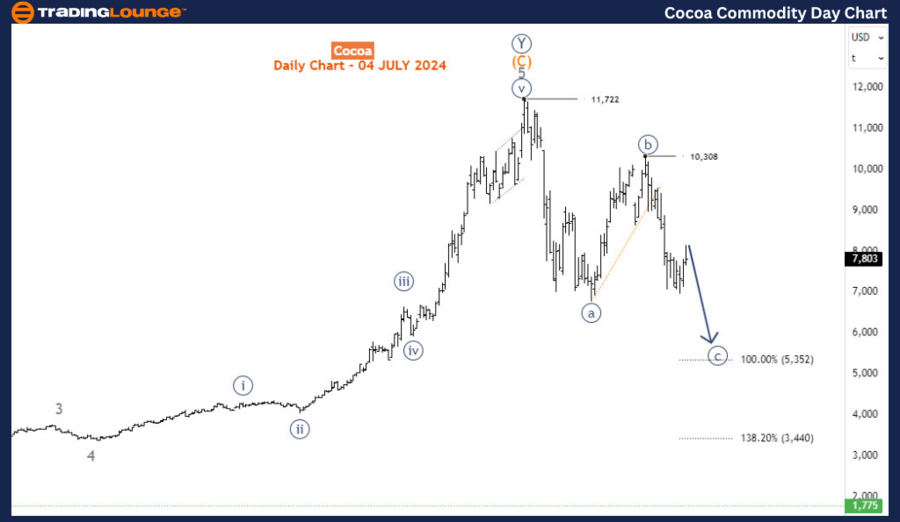
Details - Prices breached 8626 to confirm the progress of wave c (circled). Further sell-off is expected toward 5,000.
As an Elliott Wave analyst, the current trajectory of cocoa prices presents a compelling narrative. Cocoa is nearing the lows observed in May 2024, continuing its decline from the all-time high recorded on April 19, 2024, at 11,722. The commodity has since dropped by 33% from this peak. This downtrend is expected to persist, potentially driving prices toward the 5,000 mark in the coming days or weeks.
A detailed examination of the daily chart reveals that cocoa completed a significant bullish impulse wave cycle starting in September 2022, when prices were around 2,000. By April 2024, this impulse wave had driven prices up by over 430%, culminating in the all-time high. According to Elliott Wave theory, such impulse waves are typically followed by a three-wave corrective structure. The current pullback from the all-time high is thus interpreted as a corrective phase, expected to unfold in an a-b-c wave pattern.
In this context, waves a and b have already been completed, and the price is currently in the midst of wave c. Projections indicate that wave c is likely to extend to a price range between 5,000 and 5,352 before the trend potentially resumes. This projected decline aligns with the typical behavior of corrective waves following an impulsive move.
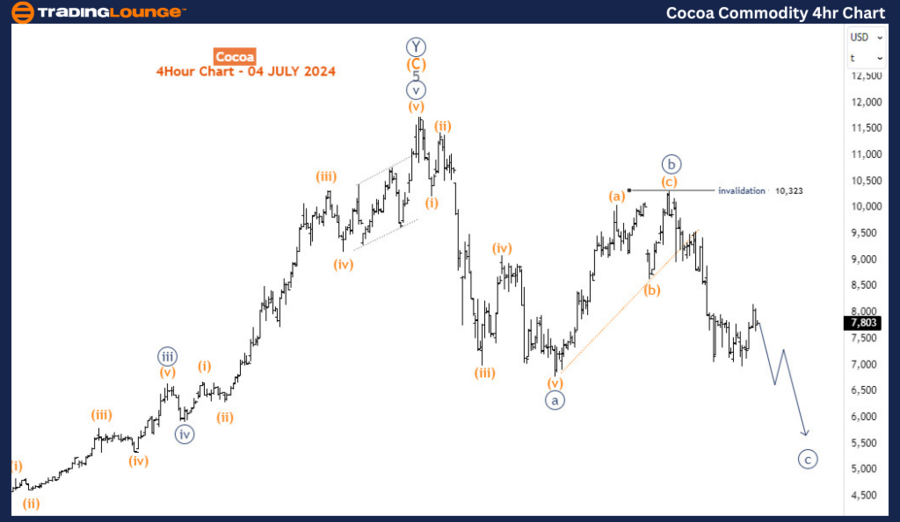
On the H4 chart, the sub-waves of the decline appear to form a potential 5-3-5 corrective structure. Within this structure, wave c is currently in its 4th sub-wave, expected to complete below the 8,958 level. Once this bounce concludes, the decline is anticipated to continue, targeting the 5,000-5,352 range previously mentioned.
An alternative scenario also warrants consideration. If the current decline morphs into a bearish impulse wave starting from the 11,722 peak, it could lead to an even more pronounced drop in cocoa prices. This scenario underscores the importance of monitoring key support levels and wave structures to accurately forecast future price movements.
In summary, the Elliott Wave analysis indicates that cocoa is in the midst of a significant corrective phase following its all-time high in April 2024. The primary expectation is for the price to decline to the 5,000-5,352 range as wave c of the corrective structure completes. However, the potential for a more extended bearish impulse wave remains, highlighting the need for vigilance in tracking price developments.
Cocoa Elliott Wave technical analysis [Video]
Author

Peter Mathers
TradingLounge
Peter Mathers started actively trading in 1982. He began his career at Hoei and Shoin, a Japanese futures trading company.


