Can gold and silver prices double or triple as rising inflation destroys savers’ wealth?

Back in 1933 when an ounce of gold was trading at only $20 per ounce, the median income for the average American household was about $1500 a year. So as you can well imagine, $20 back then could go a very long way. You could essentially go to the most expensive store in Beverly Hills and buy the most expensive suit for $20 and upon discovering this careless spending, your family and friends would think you are insane to have spent $20 on a single suit.
Now imagine you had two $20 bills in 1933 and you put one of them under your mattress and turn the other one to an ounce of gold. Fast forward to today, 88 years later. The $20 under your mattress can buy you a couple of burgers, some fries and if you are lucky, you might get some change back. However the ounce of gold you had purchased, if you sold it at today’s spot price of $1730, it would enable you to go back to that same store in Beverly Hills, buy that same suit and never hear the end of it from your family and friends on the insanity of having spent that much money on a single suit.
The purpose of that example, was to demonstrate how much the value of your money has dropped over the years and how gold could have prevented that loss in your purchasing power almost a century later.
“If you purchased 100 shares of a company’s stocks, and year after year, you saw the value of those shares dropped, how long would you hold on to it before you finally throw in the towel and dump it?” The late Wall Street legend Richard Russell once asked in reference to the value of US dollar. “A year, 5 years? How about 10 or 20 years? Even the most patient and optimistic investors would probably give up by the 2nd or 3rd year, cut their losses, dump the stocks and move on to something more stable. So ask yourself this question, if US Dollar was a stock, would you buy it?” he concluded.
Russell asked this provocative question because we buy stocks in the hopes that they gain, or at the very least, maintain their value. We would never purchase a stock with a terrible history of decline in value as has been the case with the US Dollar. And yet, we wake up every morning and eagerly show up at our jobs in the hopes that we can get more of those ever-so declining stocks called the US Dollar. If it wasn't so tragic, it would actually be funny.
Don't get me wrong, I realize that every civilized nation must have a monetary exchange system in place, with which its citizens can pay, and be paid for goods and services. I'm not criticizing that aspect of it. After all, when we pay or receive compensation for our goods and services, it is based fairly on the market value at that particular time. However what happens to the value of that money overtime as we hold on to it, is what is at the heart of that question.
One of my late father's favorite saying was "Time is your money's worst enemy!" I didn't quite understand this sentiment till years later when I realized he was talking about my money's "buying power" eroding with each passing year. Below is an example of the US Dollar’s depletion in value over the past 45 years and how time can destroy our hard earned cash.
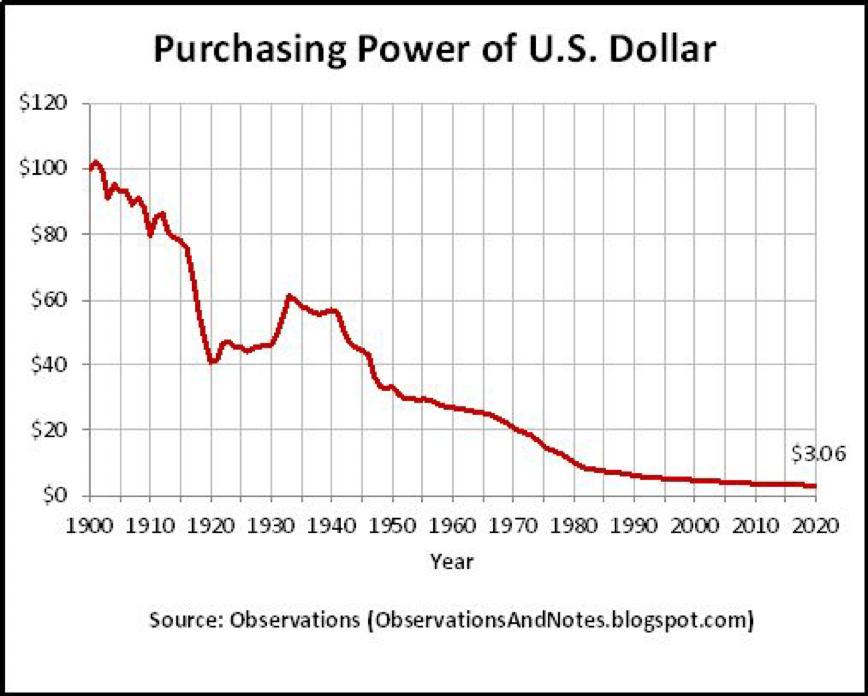
Truly amazing, isn't it? What is even more amazing is how little the average person knows or cares about this relatively rapid decline. Let me put it this way, if the Treasury Department of the United States sent an annual statement to the American people about the performance (buying power) of their dollar, there would be daily riots in the streets.
The simple truth is that US Dollar has been in steady decline since early 1900. According to the former Federal Reserve Chairman Alan Greenspan, between 1930 and today, US Dollar has lost over 98% of its value, or in a more practical sense, its buying power. That is truly astronomical if you really think about it.
There is a term for currency devaluation. It's called inflation. Most people think of inflation as ‘the price of goods and services going higher,’ but actually that is incorrect. The “value” of a dozen eggs, a pound of beef, a loaf of bread or an ounce of gold has never changed. It took no more effort for a chicken farmer in Iowa in 1933 to get a dozen eggs which sold at $0.18 cents back then than today when that farmer’s grandson sells that same dozen of eggs for $3.29. And yet, that farmer wants 1800% more money to sell that same dozen of eggs than his grandfather did back in 1933, because the value of that money has declined and so he has to make up that loss by demanding many more dollars to offset the loss.
This brings us back to the headline of this article, how much less will your money buy in goods and services in the next 10 years. To get an accurate read, first we have to see how much dollar has declined in value in a more recent history, say the last 13 years. So let’s have a look at prices for a basket of goods from 2008 through today:
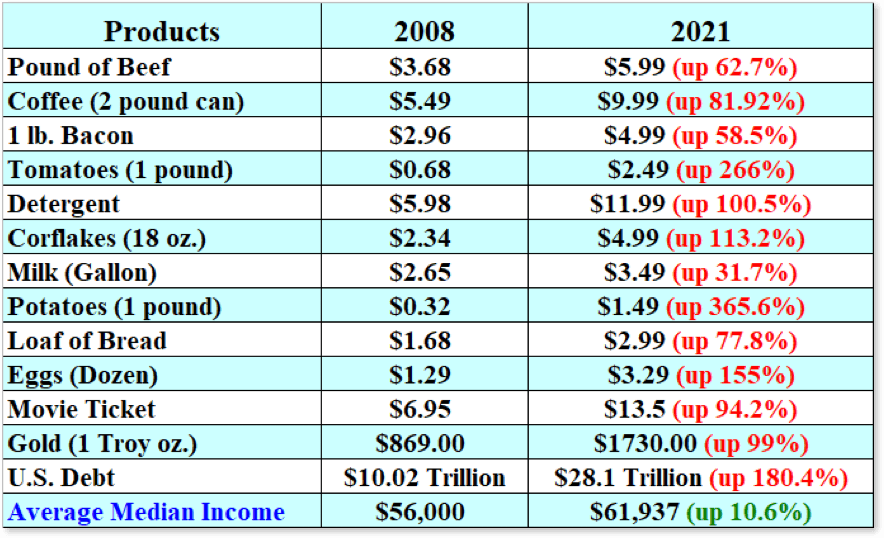
Excuse me, Mr. Powell? What was that about “we are running below 2% inflation” again? Seriously?
Looking at the above table, are you not amazed by the Federal Reserve’s repeated statements that our current inflation is below 2% level?
Someone has to bring the FED chairman Jerome Powell back to earth and take him to a corner grocery store. The simple truth is that the Fed keeps changing the metric in measuring inflation every decade or so, to conveniently fit their narrative. As I said before, it would be funny, if it wasn’t so tragic.
So what will your money be worth in the next 10 years? Based on historical facts and statistics, a lot less than it does today.
Just in the past 12 months, from March 2020 through April 2021, the value of dollar on the index has dropped from 98.7 to 93.1. That's an astonishing 9.7%, in just a single year. The question is are you brave enough to hold on to excess cash in your bank account as its value continues to erode year after year, while collecting dust instead of interest which has been set to near zero by the Federal Reserve to hide their dirty deeds in borrowing and spending at historic levels?
Here is another interesting fact. If you look at the table below, the average median income in US is currently at near $62,000 a year, which can buy 35 ounces of gold at its current price. In 2008, the median income could have purchased 64 ounces, and in 2000 when the annual median income was only $42,148, they could purchase 151 ounces.
| Year | U.S. Median Income | Gold Price Per Ounce | Ounces of Gold You Could Buy |
| 2000 | 42,148 | $279 | 151 oz |
| 2008 | 56,000 | $869 | 64 oz. |
| 2021 | 61,937 | $1,730 | 35 oz. |
This is interesting because in the past 20 years the annual income has gone up by just 47% while the price of gold has moved up over 520%, so back then your money could have purchased nearly 450% more gold than it does today. That’s how much your money has lost in value. WOW!
Why am I measuring your dollar’s buying power with the price of gold? That’s what moves the gold spot price, the value of your dollar. The inverse relationship between gold and dollar determines the buying power of your money.
Folks, you have a choice to make: Sit on your excess cash and let it collect dust at near zero interest rate while losing its value year after year, or protect it with gold and silver. Your decision will determine your buying power in the years to come as politicians fight over every pity thing in Washington while our national debt and deficit continue to soar. Remember over 26% of all dollars in existence, were printed just last year alone. With President Biden and liberals in charge of the house and senate, coming out with trillions of dollar spending Bill month in and month out, where do you think the value of your money will be in just 4 years from now?
You can sit back and do nothing or you can be proactive and protect your hard earned money with time-tested hard currencies like gold and silver.
Author

Peter Ginelli
Independent Analyst
I have been actively involved in market research and analysis for over a decade.


