Buying dips at the blue box in IBEX as more upside is expected

From the 1 hour chart below, IBEX completed a bullish cycle at around $9135 area for red wave 3. Up from black wave ((ii)) lows at $8426.01, we see an advance in five swings as an impulse. The impulse completed black wave ((iii)), Naturally, a pullback lower in black wave ((iv)) followed. This pullback unfolded as an expanding flat correction denoted a-b-c in red. Pursuant to the correction in black wave ((iv)), we saw another five swings higher, labelled blue (i)-(v); in black wave ((v)) . This completed red wave 3.
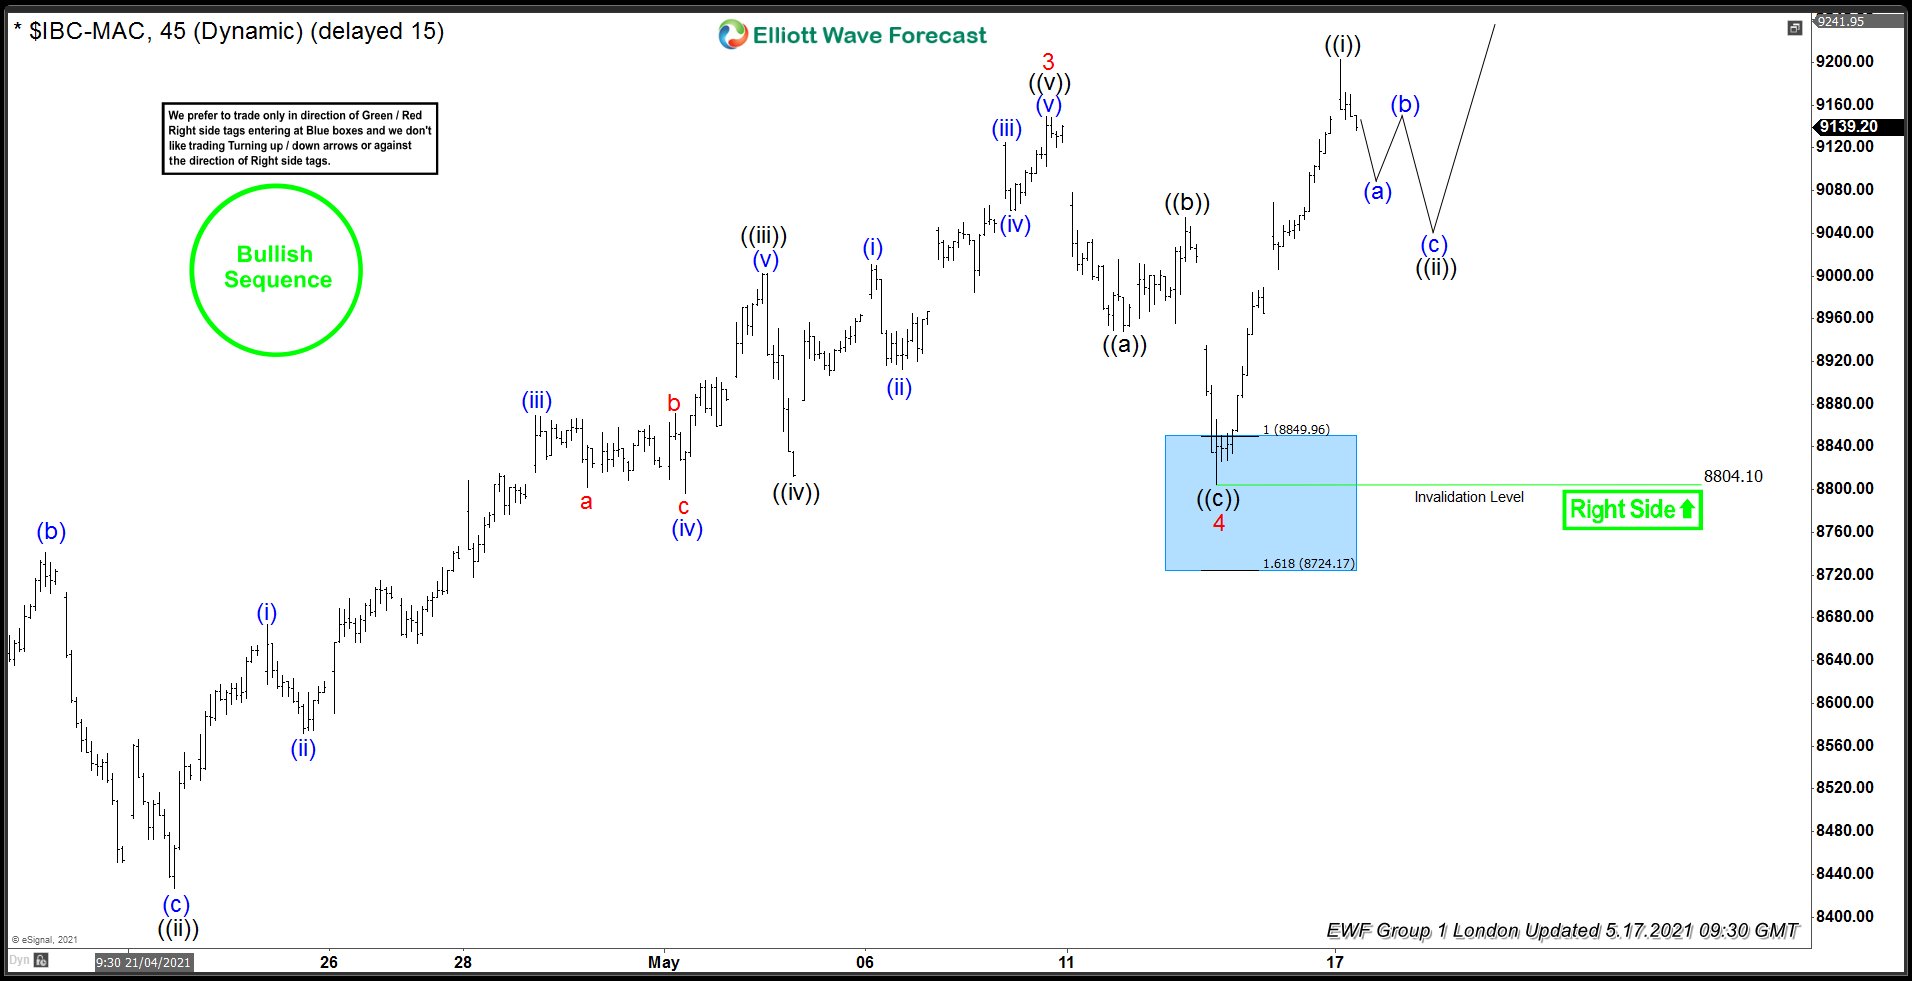
Down from red wave 3 peak, we saw a decline lower into the blue box. The decline subdivided into black waves ((a))-((b))-((c)) zigzag. Thus, completing red wave 4 in the blue box area. Although not shown, black waves ((a)) and ((c)) would subdivide into lower degree (i)-(v), each as an impulse wave, as per Elliottwave theory. Black wave ((b)) would serve as a connector. The right side was upside against $8426.01 lows. We also had a bullish sequence. Therefore, we preferred the long side from the blue box area.
Elliottwave 1 Hour Chart From 5/13/2021

The one-hour chart from shows a sharp reaction higher from the blue box. Long positions from the blue box were already running risk-free as at 5/17 during the London update. We proposed black wave ((i)) already completed. Inherently, we expected a pullback lower in black wave ((ii)), before more upside could resume. However, the anticipated pullback lower in black wave ((ii)) should find support above $8804.10 low, before turning higher in ((iii)).
Elliottwave 1 Hour Chart From 5/17/2021
Indeed, the recent 1-hour chart from 5/25/2021 shows a pullback lower in ((ii)) as expected. Furthermore, the pullback found support above $8804.10 lows. We see the index advancing further higher, and we expect it to continue towards $9410.70 equal leg area at least, before pulling back for more short-term upside. We do not prefer or propose selling any of the anticipated pullbacks, as the right side remains upside.
Elliottwave 1 Hour Chart From 5/25/2021

Author

Elliott Wave Forecast Team
ElliottWave-Forecast.com


