GBP/JPY Elliott Wave technical analysis [Video]
![GBP/JPY Elliott Wave technical analysis [Video]](https://editorial.fxstreet.com/images/Markets/Currencies/Crosses/GBPJPY/iStock-688526532_XtraLarge.jpg)
GBP/JPY Elliott Wave technical analysis
Function: Counter Trend.
Mode: Impulsive as C.
Structure: Black wave C.
Position: Red wave 4.
Direction next lower degrees: Black wave C (may started).
Details: Blue wave 5,red wave 5 of C looking completed. Now sub waves Black wave C is in play . Wave Cancel invalid level:191.335.
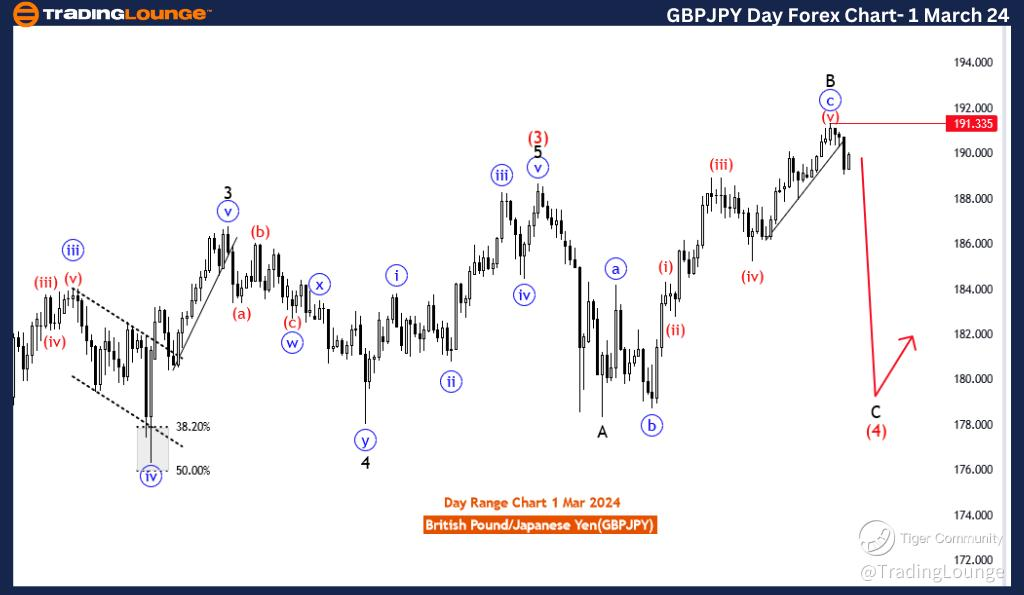
The "GBPJPY Elliott Wave Analysis Trading Lounge Day Chart" dated 1 March 24, provides a comprehensive analysis of the British Pound/Japanese Yen (GBPJPY) currency pair using Elliott Wave principles on the daily chart. The focus of the analysis is on identifying potential market movements within a counter-trend framework.
The identified "FUNCTION" is "Counter Trend," indicating a strategic orientation toward identifying potential reversals or corrective movements against the prevailing trend. This suggests that the analysis is geared towards capturing counter trend opportunities.
The specified "MODE" is "Impulsive as C," implying that the current market conditions are marked by strong and forceful price movements within the context of a corrective wave (C). Despite being in a counter-trend phase, the analysis acknowledges the impulsive nature of the price action.
The described "STRUCTURE" is "Black wave C," emphasizing the broader corrective structure within the Elliott Wave framework. This suggests an analysis focused on the completion of the larger corrective wave C.
The identified "POSITION" is "Red wave 4," indicating the current position within the Elliott Wave pattern. Red wave 4 represents a corrective phase within the broader structure of black wave C.
In terms of "DIRECTION NEXT LOWER DEGREES," the emphasis is on "Black wave C (may have started)." This indicates an anticipation of the initiation of the next phase of the corrective structure, with the caveat that it is qualified by "may have started," suggesting a degree of uncertainty.
The "DETAILS" section highlights that "blue wave 5, red wave 5 of C looking completed." This signals the completion of specific sub waves within the broader context of black wave C, and it is noted that the sub waves of black wave C are now in play.
The "Wave Cancel invalid level" is set at 191.335, serving as a critical reference point. A breach beyond this level would invalidate the current wave count, prompting a reassessment of the analysis.
In summary, the GBPJPY Elliott Wave Analysis for the daily chart on 1 March 24, underscores a focus on the completion of specific sub waves within black wave C, with attention to the potential initiation of the next phase of the corrective structure. Traders are advised to monitor the invalidation level at 191.335 for potential shifts in the wave count within the counter-trend context.
GBP/JPY Elliott Wave analysis daily chart
GBP/JPY Elliott Wave technical analysis
Function: Counter Trend.
Mode: Impulsive as C.
Structure: Sun waves of black wave C.
Position: Red wave 4.
Direction next lower degrees: Black wave C (may started).
Details: blue wave 5,red wave 5 of C looking completed. Now sub waves Black wave C is in play. Wave Cancel invalid level:191.335.
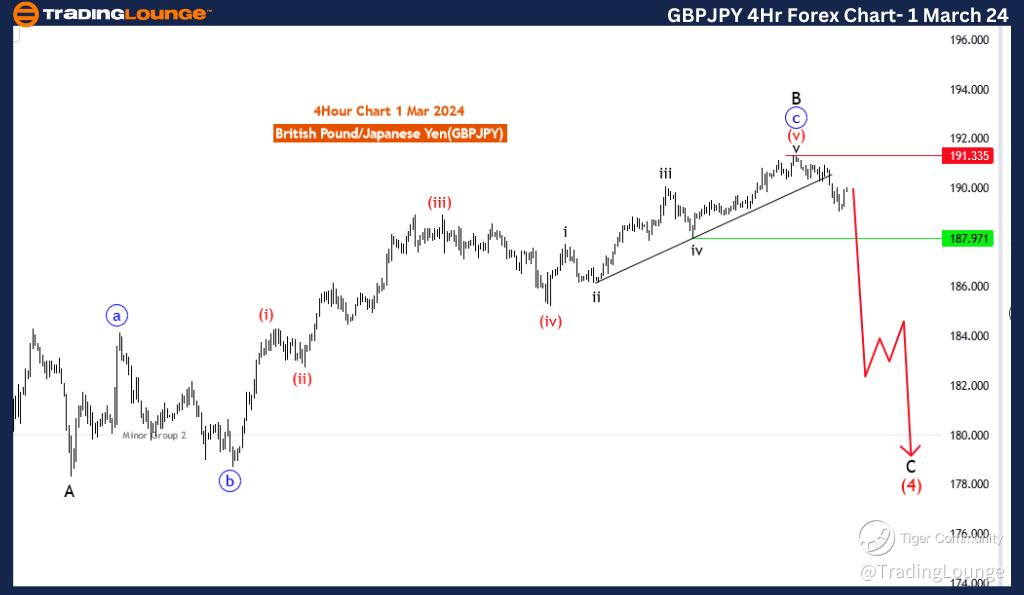
The "GBPJPY Elliott Wave Analysis Trading Lounge 4 Hour Chart" dated 1 March 24, presents a detailed examination of the British Pound/Japanese Yen (GBPJPY) currency pair, employing Elliott Wave analysis on the 4-hour chart. The analysis focuses on identifying potential market movements within the context of a counter-trend scenario.
The specified "FUNCTION" is "Counter Trend," suggesting a strategic approach that seeks to identify potential reversals or corrective movements against the prevailing trend. This indicates a focus on counter trend trading opportunities.
The designated "MODE" is "Impulsive as C," signifying that the current market conditions are characterized by strong and forceful price movements within the context of a corrective wave (C). This implies that, despite being in a counter-trend phase, there is a notable impulsive nature to the price action.
The described "STRUCTURE" is "Sub Waves of black wave C," emphasizing the focus on the sub waves within the larger corrective structure of black wave C. This suggests a detailed analysis of the internal dynamics of the ongoing correction.
The identified "POSITION" is "Red wave 4," indicating the current position within the Elliott Wave pattern. Red wave 4 represents a corrective phase within the broader structure of black wave C.
Regarding "DIRECTION NEXT LOWER DEGREES," the focus is on "Black wave C (may have started)." This implies the anticipation of the initiation of the next phase of the corrective structure, black wave C. The use of "may have started" indicates a degree of uncertainty, highlighting the need for confirmation.
In the "DETAILS" section, it is mentioned that "blue wave 5, red wave 5 of C looking completed. Now sub waves Black wave C is in play." This signals the completion of specific sub waves within the larger black wave C and the transition to the unfolding of sub waves within black wave C.
The "Wave Cancel invalid level" is set at 191.335, serving as a critical reference point. A breach beyond this level would invalidate the current wave count, prompting a reassessment of the analysis.
In summary, the GBPJPY Elliott Wave Analysis for the 4-hour chart on 1 March 24, indicates a focus on the completion of specific sub waves within black wave C, with attention to the potential initiation of the next phase of the corrective structure. Traders are advised to monitor the invalidation level at 191.335 for potential shifts in the wave count within the counter-trend context.
GBP/JPY Elliott Wave analysis four hour chart
GBP/JPY Elliott Wave analysis [Video]
Author

Peter Mathers
TradingLounge
Peter Mathers started actively trading in 1982. He began his career at Hoei and Shoin, a Japanese futures trading company.


