Brent Crude Oil rebounds amid monetary easing and market dynamics

Brent crude oil has regained its upward momentum, climbing towards 73.63 USD, following a recent decline triggered by comments from US Federal Reserve Chairman Jerome Powell. In his statement, Powell indicated that the Fed would be cautious about further easing monetary conditions, emphasizing that the rate cut schedule should not be seen as a definitive plan for all future actions by the Monetary Policy Committee (MPC).
Despite these cautious remarks, the Fed's recent decision to lower rates by 50 basis points is fundamentally seen as positive for the commodity market. Lower borrowing costs might stimulate economic demand and enhance interest in energy resources.
Concurrently, the latest data from the US Department of Energy showing a decrease in crude oil inventories by 1.63 million barrels—exceeding expectations of a 0.50 million barrel reduction—also supports bullish sentiments in the oil market. This stock reduction is especially significant as it indicates a robust demand backdrop.
Additionally, the market is closely monitoring potential increases in oil production by OPEC+ countries and the economic data coming from China, the world’s largest oil consumer. Recent weaker-than-expected economic indicators from China have cast some doubts on the sustained strength of oil demand.
The geopolitical situation in the Middle East remains a critical factor, with any escalation potentially impacting energy supply routes and market stability.
Technical analysis of Brent Crude Oil
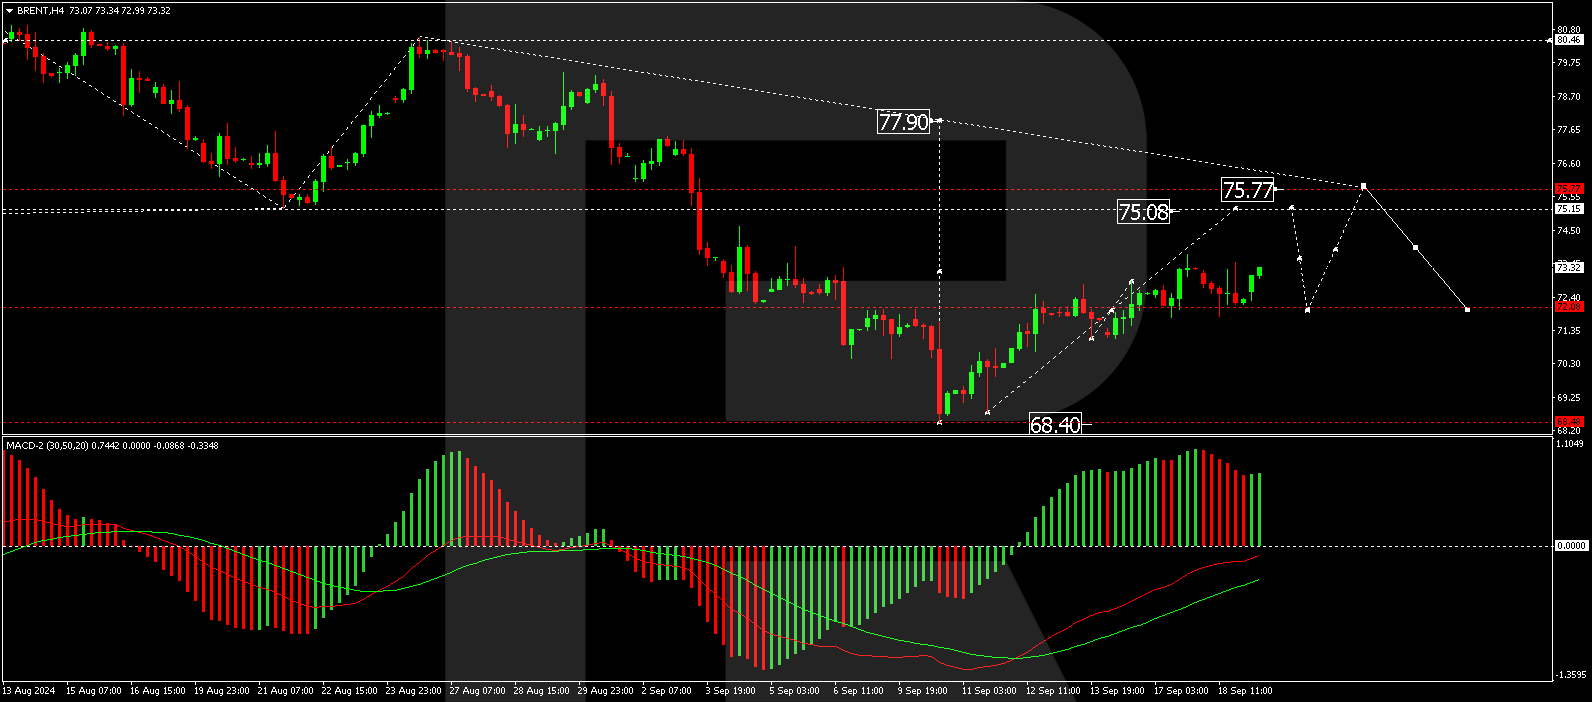
The market has established a consolidation range around 72.00 USD for the further Brent forecast, with current fluctuations extending to a high of 73.73 USD and a low of 71.78 USD. Having found support at 71.78 USD, there is potential for the market to breach the upper boundary of 73.73 USD today. A successful break above this level could indicate a continuation of the growth trend towards 75.15 USD, possibly reaching up to 75.77 USD. The MACD indicator supports this bullish outlook, with the signal line below zero but pointing upwards, suggesting an imminent upward movement.
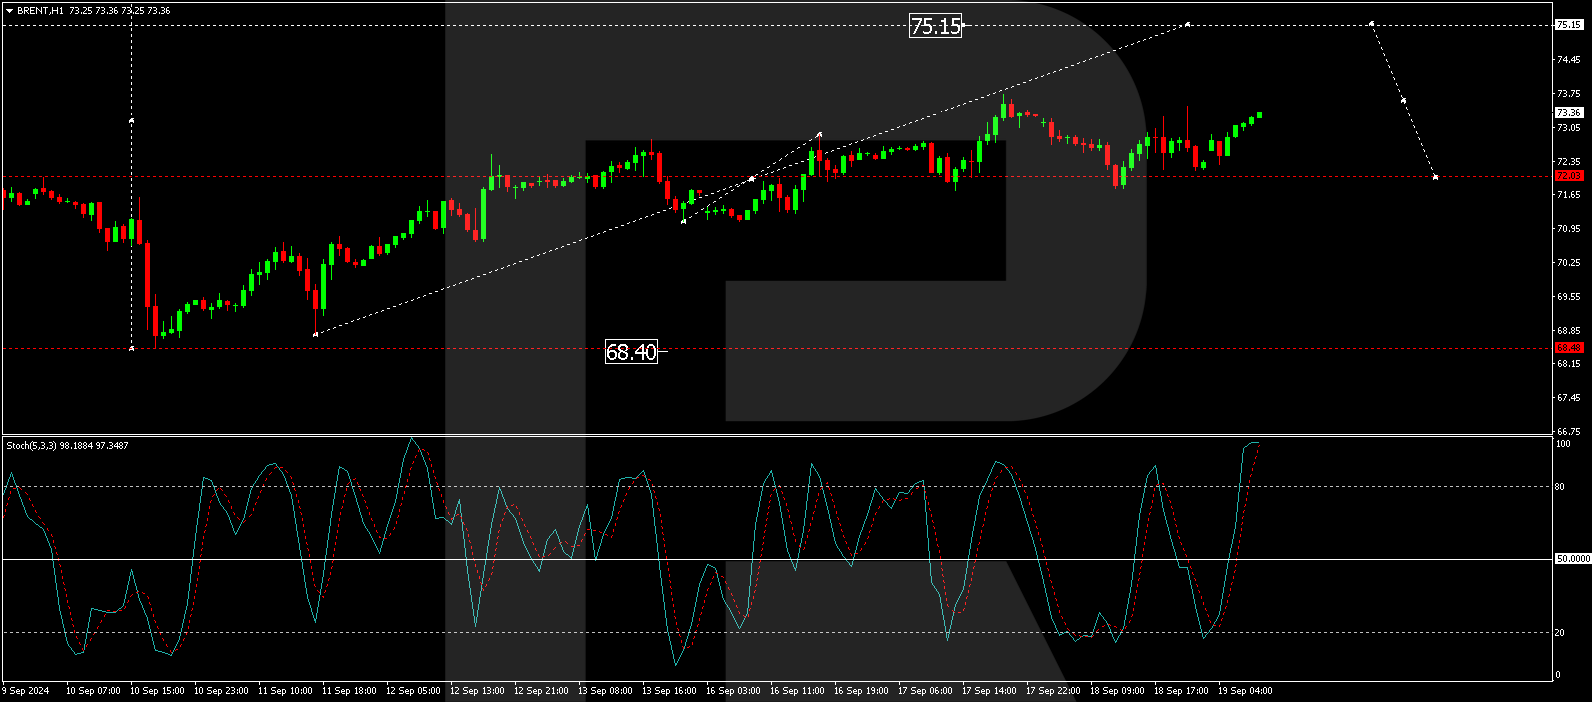
Today, Brent surpassed the 73.00 USD mark, continuing its ascent towards the target of 75.15 USD. Upon reaching this target, a retest of the 73.00 USD level from above may occur, potentially setting the stage for another upward wave towards 75.77 USD. The Stochastic oscillator, currently above 80, is poised for a temporary decline, indicating that a corrective phase could follow before further gains.
Author

Andrey Goilov
RoboForex
Higher economic education. Andrey Goilov has been working on the Forex market since 2005. A financial analyst and successful trader. Preference in trading is highly volatile instruments.