Bonds are stable – Stocks offer growth but with volatility

S2N spotlight
I thought I would treat myself with an anniversary gift and research a question that was on my mind and leave it there for today.
Many of you will have heard of a 60/40 (stock/bond) portfolio. The basic idea is that these 2 assets are uncorrelated. Bonds are secure and steady. Stocks have more growth potential but more volatility.
Normally, when there is a crisis, especially a debt crisis, the uncorrelation falls away and then everything correlates towards 1, and usually that means both assets go down together.
Here is a chart with a 60/40 portfolio that rebalances annually. The 60/40 portfolio handsomly outperforms either asset on a risk-adjusted basis; see the Sharpe Ratio.
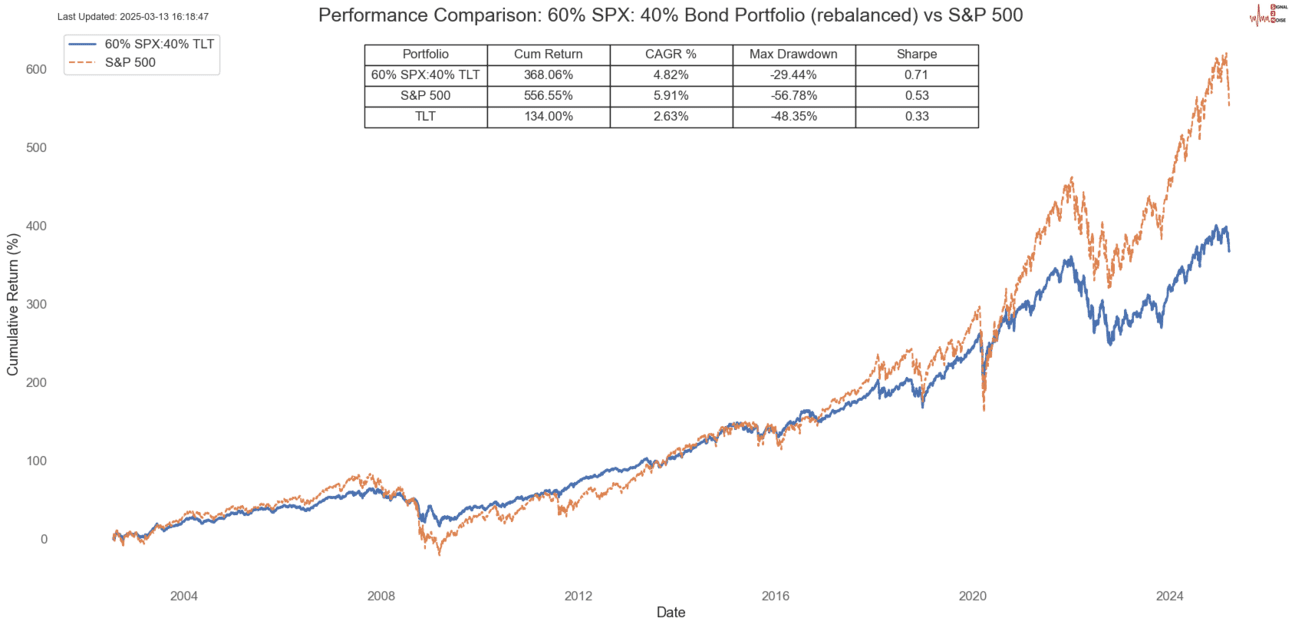
This does not tell you how the correlation of the 2 assets affects performance. What I am about to present to you is going to turn conventional wisdom on its head.
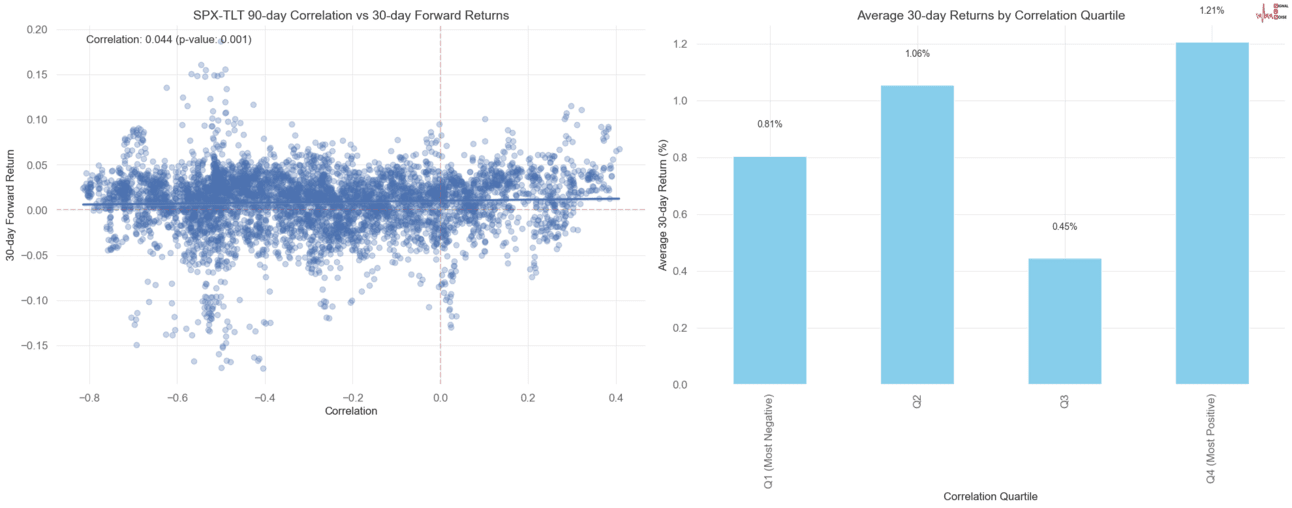
The impact of correlation on 60/40 portfolio performance:
Average Annualised Returns During Positive Correlation: 11.54%.
Average Annualised Returns During Negative Correlation: 6.09%
Difference: -5.45%
Sharpe Ratio During Positive Correlation: 1.15.
Sharpe Ratio During Negative Correlation: 0.59.
Difference: -0.56
Maximum Drawdown During Positive Correlation: 11.87%.
Maximum Drawdown During Negative Correlation: 1.78%.
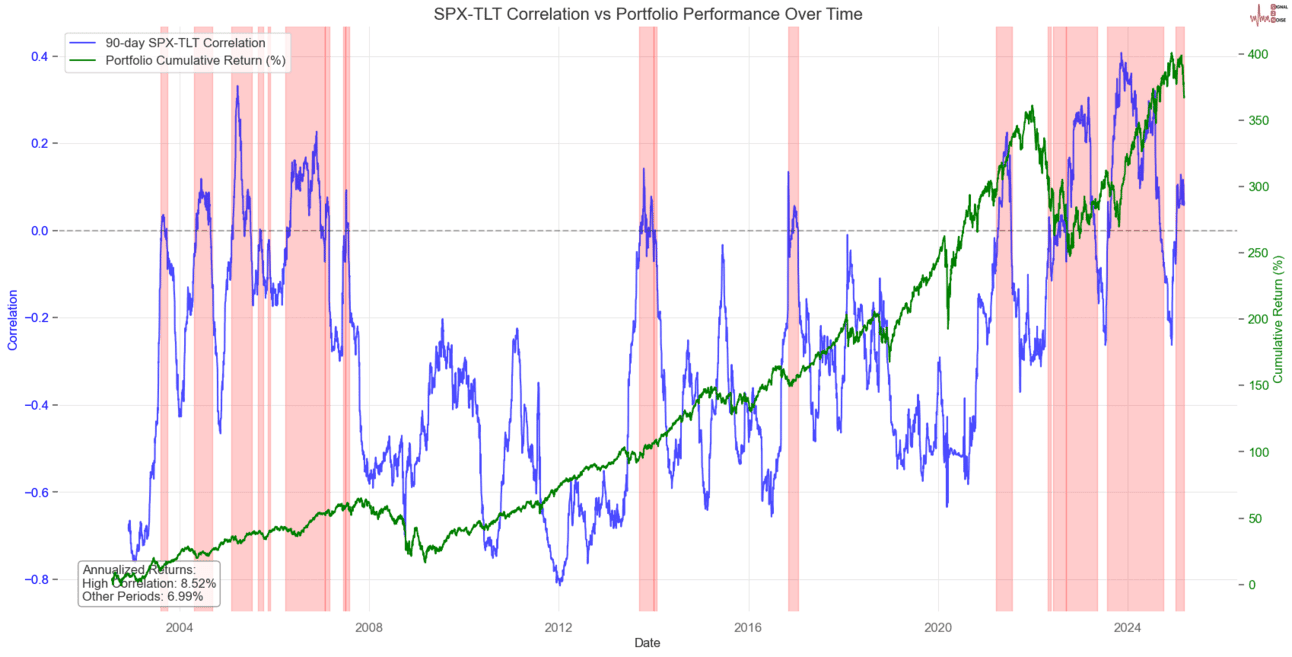
The above chart uses pink shading when the correlation (blue line) is positive. I find it helpful when analysing the portfolio equity curve.
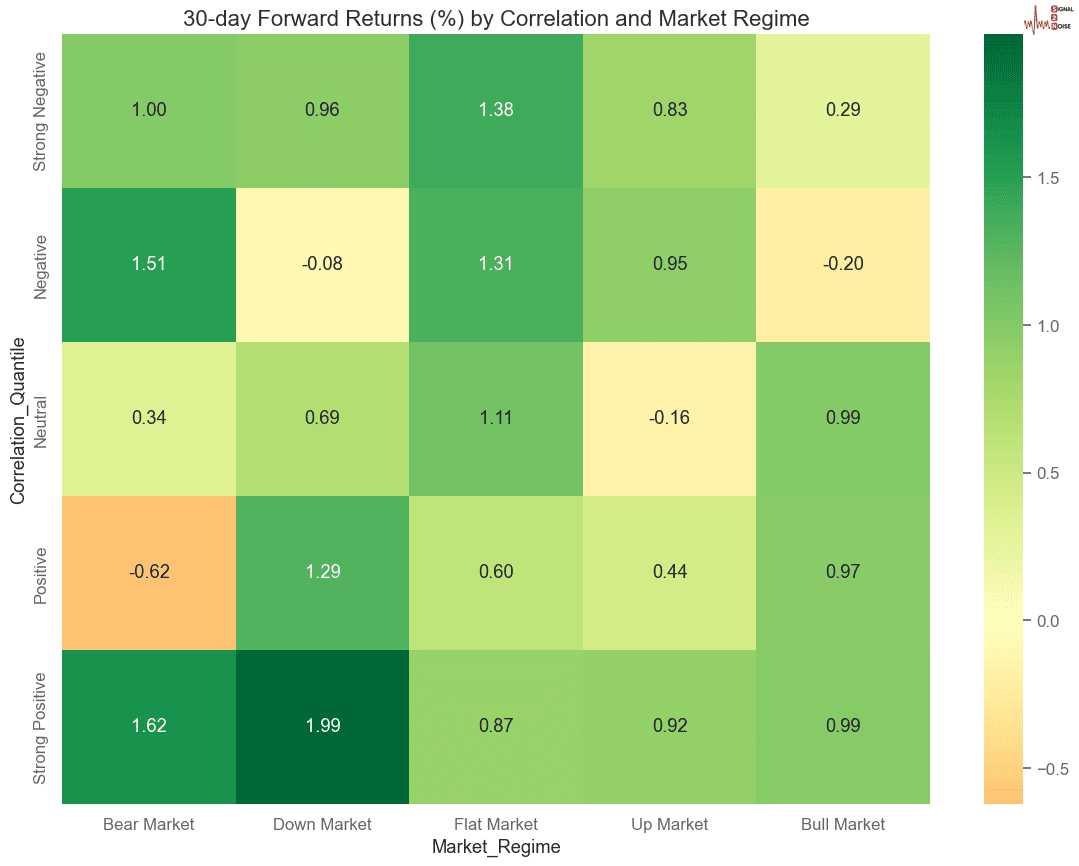
The heatmap below breaks the market into 5 different regimes and 5 (quantile) correlation groupings.
No need to panic if this seems like Greek; here is the skiny.
The surprising results highlighted show that:
-
Positive correlation periods outperform: Portfolio returns are nearly twice as high during positive correlation periods (11.54% vs 6.09%).
-
Better risk-adjusted returns with positive correlation: The Sharpe ratio is also much higher (1.15 vs 0.59).
-
Weak relationship overall: The correlation between correlation and forward returns is positive but small (0.044). In other words, don’t think you can predict the market with correlations.
Looking at the heatmap data, we see another counterintuitive finding:
-
In Bear Markets, Strong Positive correlation seems to perform well (1.62%).
-
In Down Markets, Strong Positive correlation performs best (1.99%).
This challenges the conventional wisdom that bonds should have a negative correlation with stocks during market stress to provide the most diversification benefit. Before I did this analysis, I had an intuition that the relationship is not what everyone thinks.
Twenty-five years is probably not long enough, but this produced such a cool result I am going to sit with it for a while. If you want to know what 50 years of data produces, let me know, and I will do the analysis.
S2N observations
Today is a half-day of work for me.
S2N screener alert
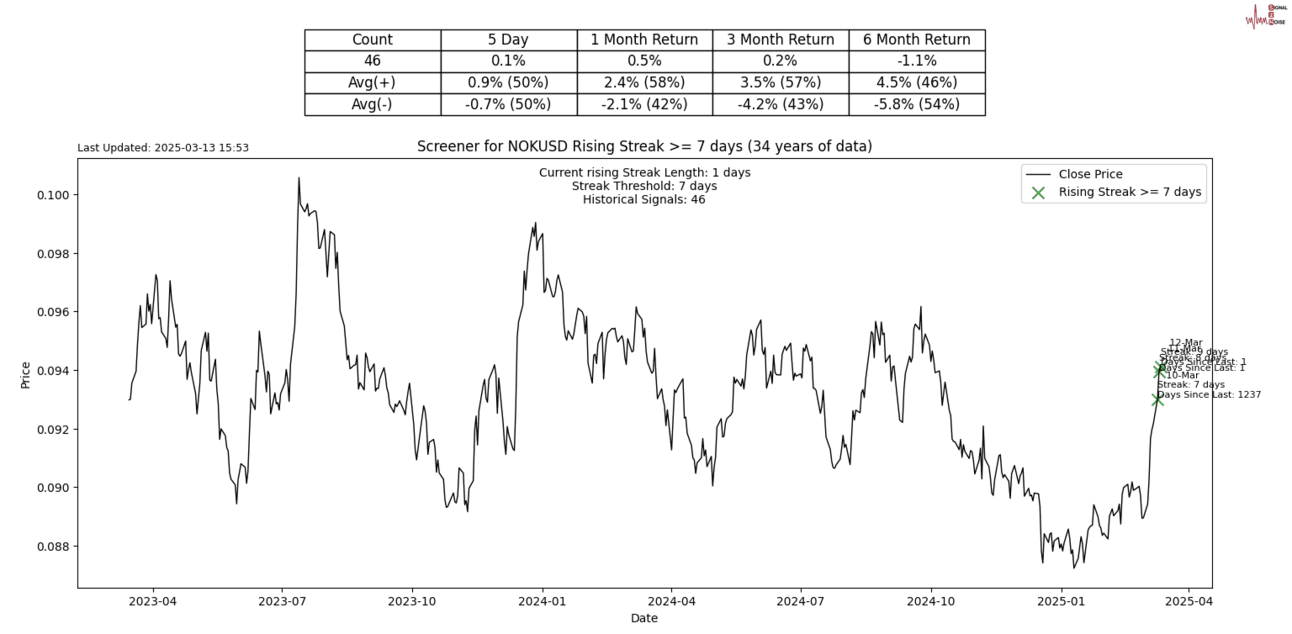
The Norwegian Kroner has strengthened against the US Dollar for 7 days in a row. A pretty rare streak, only the 46th time in 34 years.
S2N performance review
S2N chart gallery
S2N news today
Author

Michael Berman, PhD
Signal2Noise (S2N) News
Michael has decades of experience as a professional trader, hedge fund manager and incubator of emerging traders.


