Bitcoin’s correction within an ongoing bull
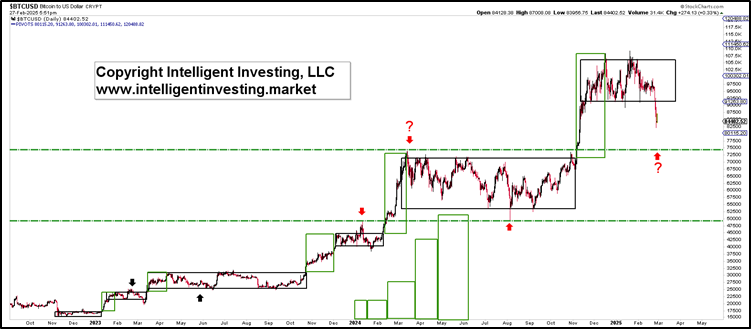
In our previous update, we observed that Bitcoin (BTCUSD) had been stuck between $92-106K since November last year. Moreover, since the new Bull started in late 2022, we found five previous range-based patterns lasting for twenty months. Each led to a breakout. Hence, we concluded that based on these last five base patterns, a breakout was to be expected targeting ideally ~$120K. Unfortunately, BTC proved us wrong, abided to the “past performance is no guarantee for future results” adage, and broke down. Thus, our alternative “Conversely, a breakdown below $92K and especially $89K can induce a waterfall decline back to the top of the previous range zone: $75K.” kicked into gear. See Figure 1 below.
Figure 1. Bitcoin’s five previous ranges and the current one
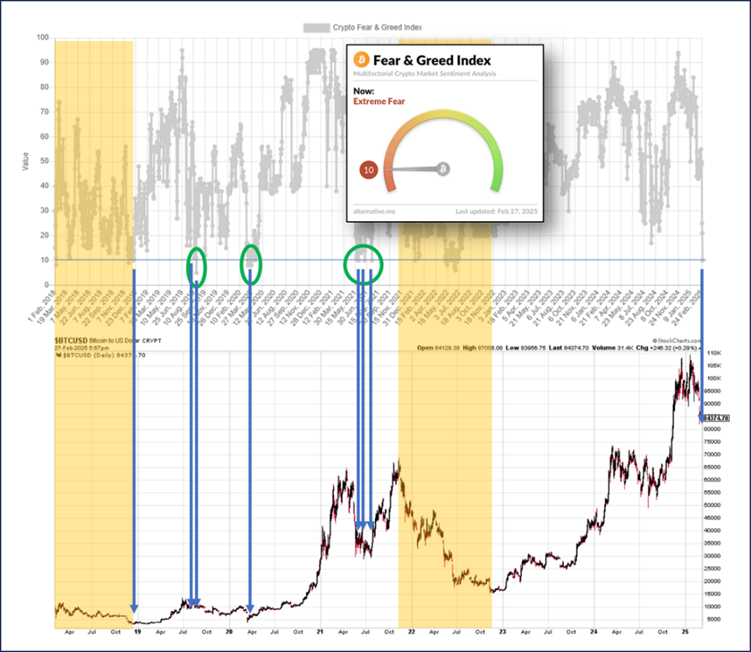
Meanwhile, the Crypto Fear and Greed Indicator registered its lowest reading since June 2022: 10. Since Bitcoin, according to its four phases is still in a Bull, we exclude the Bear markets of 2022 and 2018, and find that readings below 10 are rare and often coincide with significant bottoms. See Figure 2 below.
Figure 2. Bitcoin’s Fear and Greed Index is overlaid with its price chart
Adding our preferred long-term Elliott Wave Principle (EWP) count, Bitcoin is most likely in the green W-4. See Figure 3 below. Fourth waves tend to typically retrace 23.6 to 38.2% of the prior third wave, which in this case targets $77350-89310. However, the fourth waves in August 2024 and July 2021 retraced ~50%, see the blue horizontal arrows, which could happen now too. That would target ~$67500. Back then BTCUSD rallied 140 and 120%, respectively, which would target $148500-185640 for the current Bull.
Figure 3. Our preferred detailed, long-term EWP count for Bitcoin
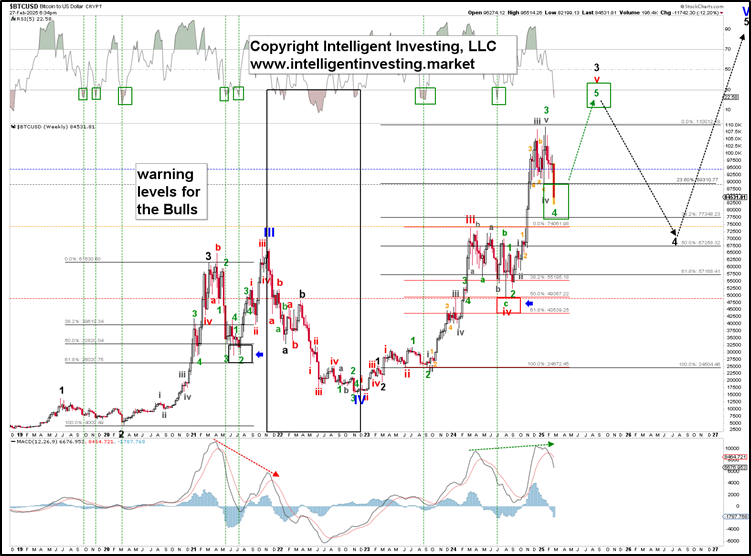
Besides, the weekly RSI5 is now at 22, and such low readings during prior Bull markets coincided with significant bottoms: see the vertically dotted green lines in Figure 3 above. Lastly, the MACD made a higher high in December 2024 compared to March 2024, confirming the higher prices (dotted green arrow). We will need to see non-confirmation, i.e., negative divergence, like in 2021 (dotted red arrow) to signal a larger top is in place.
Thus, given the highly negative sentiment readings, oversold technical indicators, the four phases, and our preferred EWP count, we concluded that a new Bear market has not yet started but that the current decline is a correction within a more significant uptrend ending later this year, targeting $148500-185640, with an ideal of ~$166.7K.
Author

Dr. Arnout Ter Schure
Intelligent Investing, LLC
After having worked for over ten years within the field of energy and the environment, Dr.


