Bitcoin Crashes to New Lows

On Sunday, bitcoin hit new intraday lows of $5,782, falling below the previous lows of $5,968 on February 6.
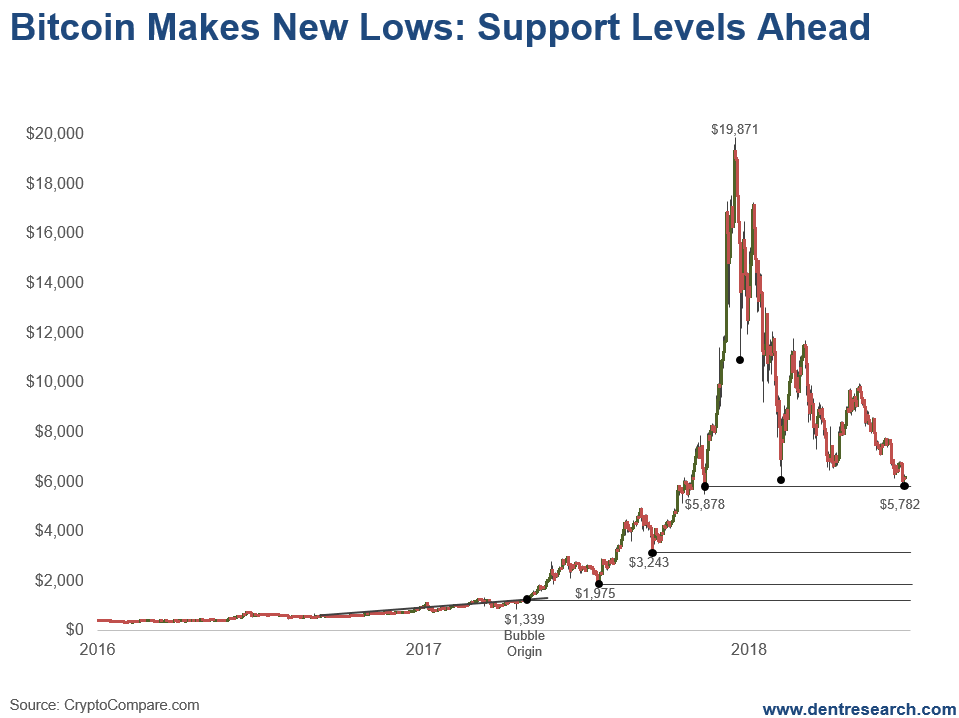
The first crash happened over five days, dropping down to $10,876 (first point after the peak). bitcoin was down 45.3% from the all-time intraday highs of $19,871 on December 17, 2017.
In a more typical five to six-year stock bubble, the first crash averages 42% in 2.6 months. But this bubble was the most extreme in history, even topping the infamous tulip bubble of 1636. It took only 7.7 months to build from its bubble origin of around $1,339 on April 27, 2017 (first point on chart).
That’s a 14.8 times gain!
The first intraday low overall hit just 1.4 months later at $5,968 on February 6, 2018 (second point after the peak).
That was a crash of 70% from the intraday high.
The low on Sunday beat out that low by almost 200 points, and is bouncing today (June 25th) up to over 6,300 so far.
If bitcoin cannot hold near these recent lows of $5,782, it could be ominous in the weeks ahead!
Keep in mind that I’m using intraday numbers for the crash points as that’s what will trigger stops for most traders and investors.
Now, look at the support levels from the bubble on the way up. I quote these on closing numbers, not intraday, as that is more typical for that type of analysis.
The first one is at $5,878 on November 12, 2017. We’re in the process of testing that level. Intraday numbers have already breached that level. If bitcoin closes further below there, it would be more dangerous.
If that’s broken, the next support level would come down around $3,243, the low on September 14, 2017. That would be down 83.2% from the closing all-time high of $19,345.
The next support level comes in at $1,975 on July 15, 2017. That would be a crash of 89.8% from the high… real bubble crash territory…
If it goes that far, it’s likely to go all the way back to the bubble origin of around $1,333 on April 27, 2017, with a 93.1% crash. That’s comparable to the dot-com bubble from 1999 into early 2000 – and the tulip bubble as well.
Frankly, I think there are two likely scenarios:
The first being that bitcoin does hold near the recent lows and support levels of November 2017.
And for the second, the bubble bursts fully and we see a 93%-plus crash.
A clear break below $5,782 favors the second scenario.
While a break up above $7,800 leans towards the first.
If the bubble takes the same time to crash as it did to build, then the lows could be seen around early August.
The dot-com bubble had a similar crash after a very sharp and quick buildup – which went on to see a 16-year bull market, along with another great bubble from early 2009 into 2018 (so far).
This isn’t the end of the broader blockchain technology movement… but it is the end of the first sharp bubble…
Author

Harry S. Dent, MBA
Dent Research
Harry S. Dent Jr. studied economics in college in the ’70s, but found it vague and inconclusive. He became so disillusioned by the state of his chosen profession that he turned his back on it.


