Biden steps down

USD: Sept '24 is Down at 103.895.
Energies: Aug '24 Crude is Down at 78.27.
Financials: The Sept '24 30 Year T-Bond is Up 9 ticks and trading at 119.13
Indices: The Sept '24 S&P 500 emini ES contract is 116 ticks Higher and trading at 5582.75.
Gold: The Aug'24 Gold contract is trading Up at 2406.00
Initial conclusion
This is not a correlated market. The USD is Down and Crude is Down which is not normal, but the 30 Year T-Bond is trading Up. The Financials should always correlate with the US dollar such that if the dollar is Higher, then the bonds should follow and vice-versa. The S&P is Higher and Crude is trading Lower which is correlated. Gold is trading Higher which is correlated with the US dollar trading Down. I tend to believe that Gold has an inverse relationship with the US Dollar as when the US Dollar is down, Gold tends to rise in value and vice-versa. Think of it as a seesaw, when one is up the other should be down. I point this out to you to make you aware that when we don't have a correlated market, it means something is wrong. As traders you need to be aware of this and proceed with your eyes wide open. Asia traded Lower with the exception of the Hang Seng exchange. Currently all of Europe is trading Higher.
Possible challenges to traders
-
No Major economic news to speak of.
-
Lack of Major economic news.
Traders, please note that we've changed the Bond instrument from the 10 year (ZN) to the 2 year (ZT). They work exactly the same.
We've elected to switch gears a bit and show correlation between the 10-year Treasury notes (ZN) and the S&P futures contract. The YM contract is the Dow Jones Industrial Average, and the purpose is to show reverse correlation between the two instruments. Remember it's likened to a seesaw, when up goes up the other should go down and vice versa.
On Friday the ZT migrated Higher at around 8:45 AM EST after the economic news was released. If you look at the charts below the ZT gave a signal at around 8:45 AM and started its Upward climb. Look at the charts below and you'll see a pattern for both assets. The Dow moved Lower at 8450 AM and the ZT moved Higher at around the same time. These charts represent the newest version of BarCharts, and I've changed the timeframe to a 15-minute chart to display better. This represented a Long opportunity on the 2-year note, as a trader you could have netted about 20 plus ticks per contract on this trade. Each tick is worth $7.625. Please note: the front month for ZT is Sept and the Dow is now Sept '24. I've changed the format to filled Candlesticks (not hollow) such that it may be more apparent and visible.
Charts courtesy of Barcharts
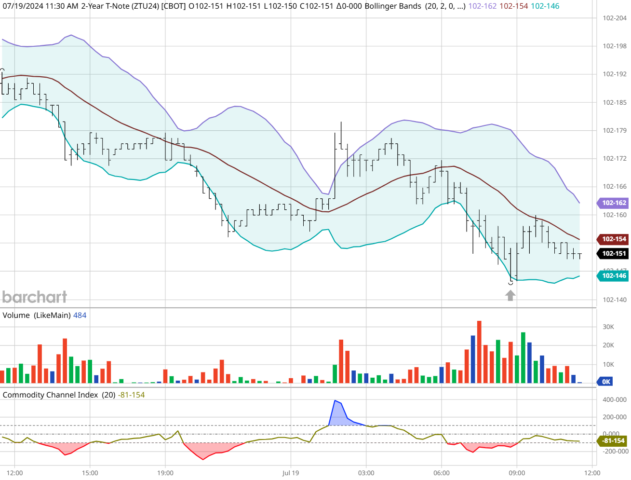
ZT -Sept 2024 - 07/19/24
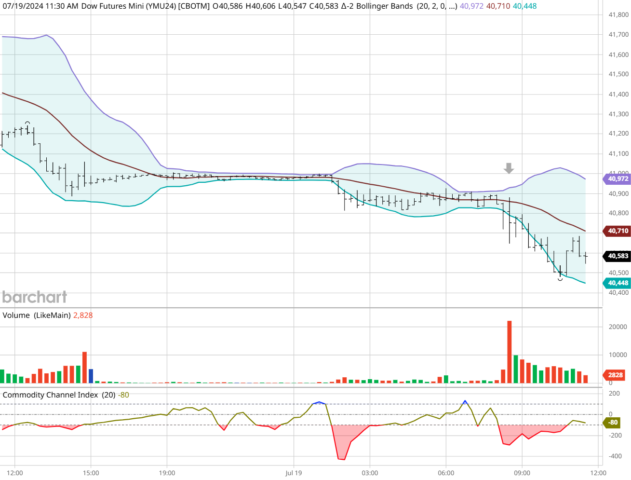
Dow - Sept 2024 - 07/19/24
Bias
On Friday we gave the markets an Upside bias as we felt there was enough evidence of market correlation. The markets however had other ideas as the Dow fell by 377 points and the other indices lost ground as well. Today we aren't dealing with a corelated market, and our bias is to the Upside.
Could this change? Of Course. Remember anything can happen in a volatile market.
Commentary
Yesterday when we viewed the markets, we felt there was enough evidence to call for an Upside Day and initially the markets rose. There were however a number of factors that changed the landscape. Globally there was a worldwide Internet outage that affected banks, airlines, brokerage accounts etc. Additionally at that point the Biden decision was still outstanding. Today as I write this, it was just announced that President Biden has decided to step down from re-election and has thrown his support to the current Vice President Kamala Harris. This may have ramifications on the markets in the time ahead as we knew what we had with Biden; we don't know that with Harris. My take is that this will not bode well for the Democrats. The last time this happened was 1980 when Ted Kennedy tried to usurp then President Jimmy Carter which weakened the Dems and Ronnie Reagan became President. It looks like history may repeat itself, but we shall see.
Author

Nick Mastrandrea
Market Tea Leaves


