AUD/USD forex analysis and Elliott Wave technical forecast [Video]
![AUD/USD forex analysis and Elliott Wave technical forecast [Video]](https://editorial.fxstreet.com/images/Markets/Currencies/Majors/AUDUSD/money-growth-6235270_XtraLarge.jpg)
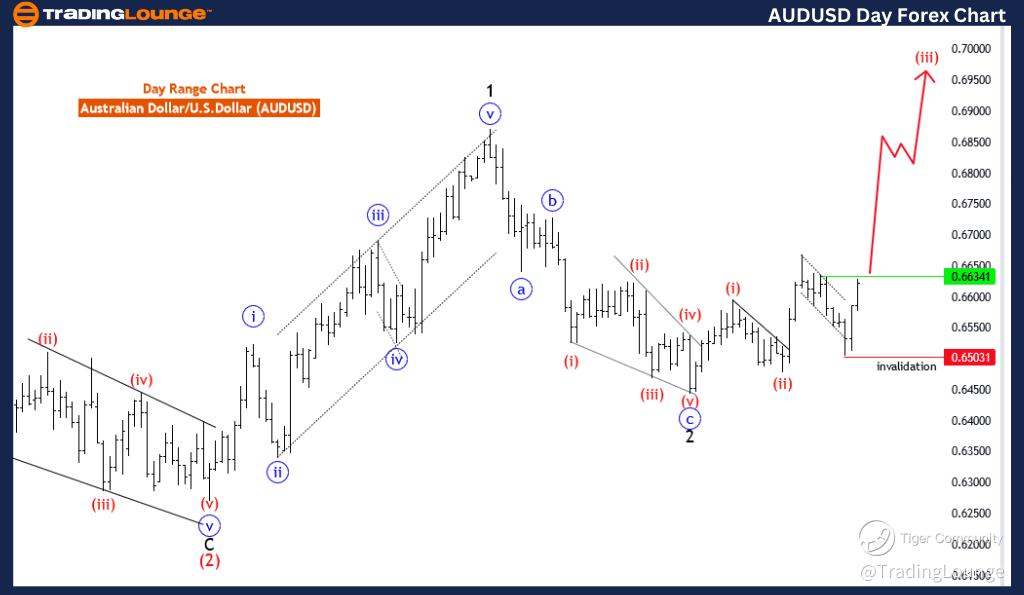
AUDUSD Elliott Wave Analysis Trading Lounge Day Chart,
Australian Dollar/U.S.Dollar(AUDUSD) Day Chart.
AUD/USD Elliott Wave technical analysis
Function: Trend.
Mode: Impulsive.
Structure: Red wave 3.
Position: Blue Wave 1.
Direction next lower degrees: Red wave 4.
Details: Red wave 2 looking completed at 0.64780. Now sub waves of red wave 3 of 1 is in play. Wave Cancel invalid level: 0.65031.
The AUD/USD Elliott Wave Analysis for the day chart provides insights into potential price movements of the Australian Dollar/U.S. Dollar currency pair based on Elliott Wave principles within technical analysis.
Identified as a "Trend" scenario, the analysis suggests that the current market direction aligns with the broader trend, indicating a potential continuation of the prevailing price movement.
Described as "Impulsive" in mode, the analysis indicates that the current price action exhibits strong and directional movement, signaling significant momentum in the market.
The "STRUCTURE" is labeled as "red wave 3," implying that the market is currently within the third wave of a larger Elliott Wave cycle. This suggests that the current price movement is part of a strong and sustained uptrend in the market.
Positioned as "blue wave 1," the analysis indicates that the current wave count is within a higher-degree Elliott Wave cycle, providing insights into potential price targets and trend continuation levels.
The "DIRECTION NEXT LOWER DEGREES" is identified as "red wave 4," suggesting the anticipated direction for the subsequent lower-degree wave. This implies that after the completion of the current wave, the market may experience a corrective phase before potentially resuming its upward movement.
In the "DETAILS" section, it is mentioned that "red wave 2 looking completed at 0.64780. Now subwaves of red wave 3 of 1 are in play." This suggests that the corrective phase has likely ended, and the market is now poised to continue its upward movement within the current wave.
The "Wave Cancel invalid level" is specified as 0.65031, serving as a critical threshold. A breach beyond this level would invalidate the current wave count, necessitating a reassessment of the analysis.
In summary, the AUD/USD Elliott Wave Analysis for the day chart offers traders valuable insights into potential price movements, trend continuation phases, and critical levels to monitor for trading opportunities.
AUDUSD Elliott Wave Analysis Trading Lounge 4 Hour Chart,
Australian Dollar/U.S.Dollar(AUDUSD) 4 Hour Chart.
AUD/USD Elliott Wave technical analysis
Function: Trend.
Mode: Impulsive.
Sstructure: Black wave 3.
Position: Red wave 3.
Direction next lower degrees: Black wave 4.
Details: Black wave 2 looking completed at 0.65031. Now black wave 3 of 3 is in play. Wave Cancel invalid level: 0.65031
The AUD/USD Elliott Wave Analysis for the 4-hour chart provides a comprehensive insight into the potential price movements of the Australian Dollar/U.S. Dollar currency pair based on Elliott Wave principles within technical analysis.
Identified as a "Trend" scenario, the analysis suggests that the prevailing direction of the market is in alignment with the broader trend, indicating a potential continuation of the current price movement.
Described as "Impulsive" in mode, the analysis indicates that the current price action is characterized by strong and directional movement, suggesting a significant momentum in the market.
The "STRUCTURE" is labeled as "black wave 3," indicating that the market is currently in the third wave of a larger Elliott Wave cycle. This suggests that the current price movement is part of a strong and sustained trend in the market.
Positioned as "red wave 3," the analysis suggests that the current wave count is within a lower-degree Elliott Wave cycle, providing insights into potential price targets and trend continuation levels.
The "DIRECTION NEXT LOWER DEGREES" is identified as "black wave 4," indicating the expected direction for the subsequent lower-degree wave. This implies that once the current wave completes, the market may experience a corrective phase before potentially resuming its upward movement.
In the "DETAILS" section, it is mentioned that "black wave 2 looking completed at 0.65031. Now black wave 3 of 3 is in play." This suggests that the corrective phase has likely ended, and the market is now poised to continue its movement in the direction of the broader trend.
The "Wave Cancel invalid level" is specified as 0.65031, serving as a critical threshold. A breach beyond this level would invalidate the current wave count, necessitating a reassessment of the analysis.
In summary, the AUD/USD Elliott Wave Analysis for the 4-hour chart provides traders with valuable insights into potential price movements, trend continuation phases, and critical levels to monitor for trading opportunities.
AUD/USD Elliott Wave technical analysis [Video]
Author

Peter Mathers
TradingLounge
Peter Mathers started actively trading in 1982. He began his career at Hoei and Shoin, a Japanese futures trading company.


