Australian CPI data: AUD/USD and AUD/NZD pairs on the radar

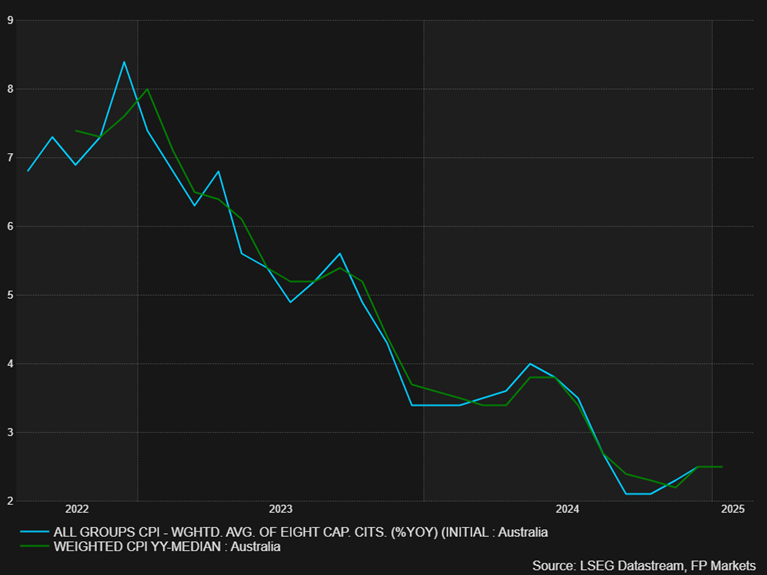
Australian CPI inflation data (Consumer Price Index) will be released tomorrow at 12:30 am GMT. Based on estimates from Refinitiv, the year-on-year (YY) CPI print is forecast to have risen by 2.5% in January, matching December’s reading (2024). However, the current estimate range remains broad: between a high of 2.9% and a low of 2.1%.
RBA: Cautionary cut
Last week, the Reserve Bank of Australia (RBA) kicked off its easing cycle, lowering the Cash Rate by 25 basis points (bps) to 4.10% from 4.35%. Citing easing inflationary pressures, the rate cut – its first since 2020 – followed 13 rate hikes that commenced in early 2022.
Although the move was widely anticipated, market participants largely viewed the policy move as hawkish; the RBA remained data-dependent and essentially poured cold water on further easing in the immediate term. RBA Governor Bullock also emphasised this in her press conference. Nevertheless, money markets are still eyeing May’s meeting for another 25 bp cut, with another 25 bp reduction potentially in the books at the tail end of the year.
The RBA highlighted that the Australian jobs market is tight – interestingly, jobs growth for January grew by 44,000, comfortably surpassing market estimates of a 20,000 gain. Alongside this, underlying inflation forecasts were revised slightly higher. However, on the dovish side of things, as already noted, the central bank recognised that inflation had cooled quicker than expected, wage pressures had eased, and growth was subdued in private demand.
Technicals indicate AUD/USD downside
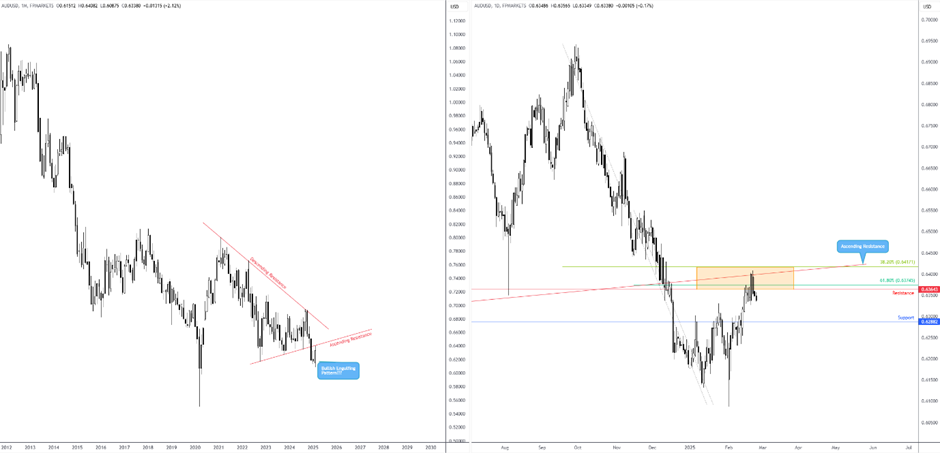
Given the RBA’s data-dependent approach, the AUD/USD (Australian dollar versus the US dollar) will be a widely watched pair. As evident from the monthly (left) and daily (right) charts below, price action is shaking hands with reasonably clear resistance.
Coupled with a local ascending resistance on the monthly chart that’s in play (extended from the low of US$0.6170) and a daily resistance zone between US$0.6417 and US$0.6364 (made up of a handful of Fibonacci retracement ratios and a horizontal resistance), this is an area I will be observing closely. Should tomorrow’s inflation surprise to the downside, this could increase rate cut bets from the RBA and weigh on the AUD, consequently supporting a short from the aforesaid resistance to at least daily support from US$0.6288. On the other hand, an upside deviation in the inflation data could push the pair beyond current resistance and encourage breakout buying.
AUD/NZD hovering ahead of support
Another pair I will be monitoring closely is the AUD/NZD cross (Australian dollar versus the New Zealand dollar). The Reserve Bank of New Zealand (RBNZ) pencilled in a third consecutive 50 bp rate cut last week, bringing the Official Cash Rate (OCR) to 3.75% from 4.25%. Unlike the RBA’s cautious tone, the RBNZ struck a dovish stance, noting the scope to ease policy further this year ‘if economic conditions continue to evolve as projected’. Of note, the RBNZ also projected a lower OCR this year than the November 2024 projections, broadly aligning with market pricing. Investors forecast 54 bps worth of cuts this year, with the first 25 bp rate cut possibly as soon as the next meeting in April.
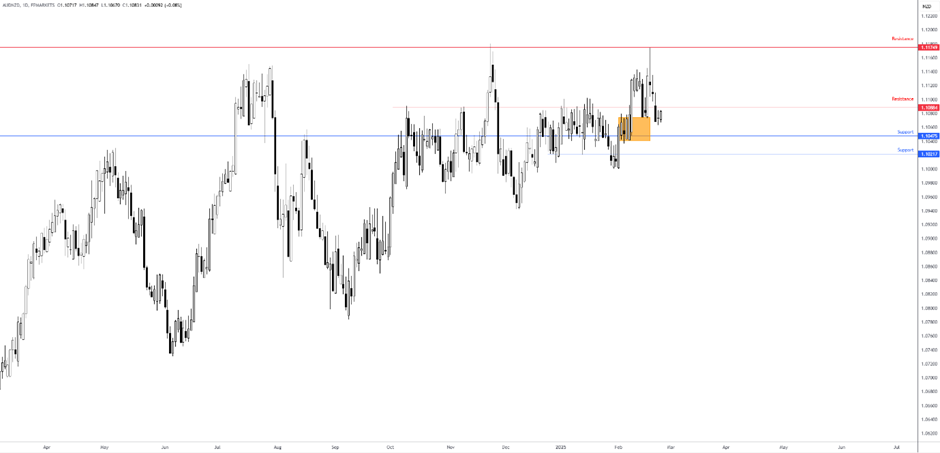
In any case, technically, the AUD/NZD pair faded long-term daily resistance from NZ$1.1175 (boasting history as far back as 2018) and recently stepped beneath daily support at NZ$1.1088 (now marked resistance). The next downside support target can be found at NZ$1.1048. While resistance is in play, it is essential to note that the trend remains to the upside, albeit momentum has slowed considerably.
Should we see stronger Australian inflation data tomorrow, I will watch for a spike to support from NZ$1.1048 followed by a rebound or a break north of resistance at NZ$1.1088. Given how close these levels are to current price action, immediately attempting to trade out of the risk event could be challenging; the more prudent approach could be to observe price action before pulling the trigger, if at all.
Conversely, a downside surprise in the inflation data would have me looking at a break of NZ$1.1048. This could open the door for a short-term selling opportunity towards support at NZ$1.1022. A break lower also makes sense from a technical perspective. The area I highlighted in orange is between NZ$1.1040 and NZ$1.1074 and will likely be viewed as robust demand in light of the base holding firm on 18 February (thanks to the RBA’s hawkish cut). Therefore, with protective stop loss orders likely positioned beneath this zone (sell stops), a break of here could trigger short-term breakout selling towards the next evident support at NZ$1.1022 (which I expect may trigger some profit-taking).
Charts created using TradingView
Author

Aaron Hill
FP Markets
After completing his Bachelor’s degree in English and Creative Writing in the UK, and subsequently spending a handful of years teaching English as a foreign language teacher around Asia, Aaron was introduced to financial trading,


