|

AUD/USD Technical Analysis

AUDUSD: On June 10/2019 I posted on Twitter @AidanFX a possible bearish market pattern. On the Daily chart AUDUSD has been trending lower since 2018 so it would only make sense to follow the trend and continue to look for possible selling opportunities. The chart below shows the possible reversal zone where AUDUSD can sell off from and where sellers/bears can be waiting to push the pair lower.

AUD/USD Daily Chart June 10/2019

AUDUSD

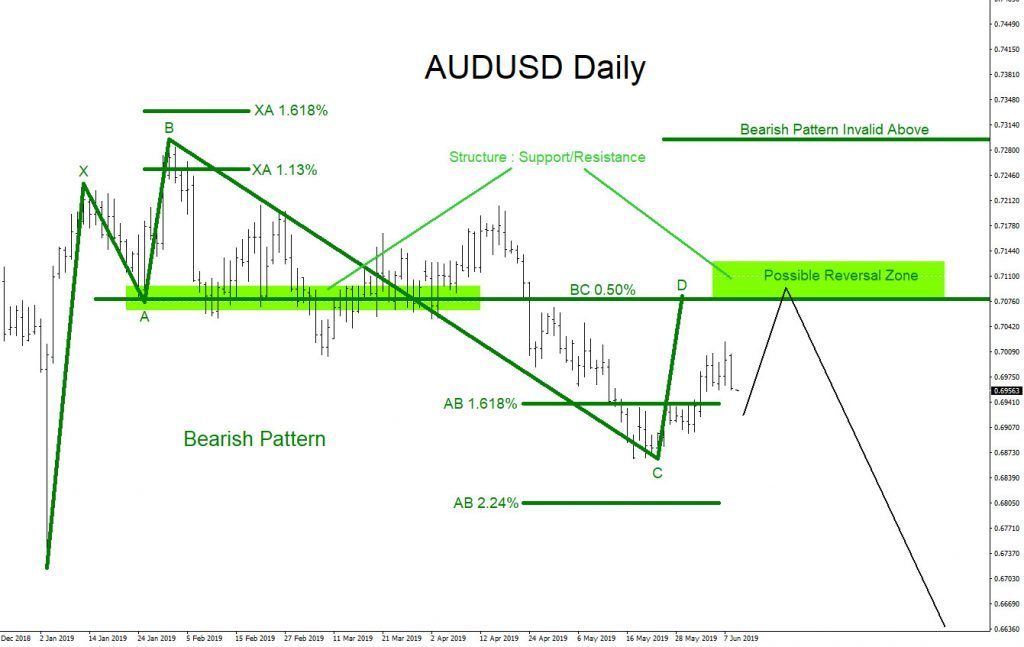
In the chart below, AUDUSD did not move higher to the reversal zone from the June 10/2019 Daily chart and instead made another push lower first. But on the push lower price stayed in the area of the AB 1.618% – 2.24% Fib. retracement levels where the point C of the green bearish pattern must terminate for the pattern to remain valid. After point C terminated the pair then pushed higher to the reversal zone and found sellers to complete the point D of the bearish pattern. The bearish market pattern triggered sells at the BC 0.50% Fib. retracement level where price was also met with a support/resistance structure to add more technical sellers to enter the market. More sellers eventually entered on the simple break below the black trend line which confirmed bears were in control. The break below the black trend line is where I entered the SELL trade with stops above the July 19/2019 high.

AUD/USD Daily Chart August 2/2019

AUDUSD

In the chart below, AUDUSD has tagged the 1:2 RR target making my trade a winner already. We continue to expect more downside to come in the following days/weeks and will need to watch and wait to see if price will tag my remaining targets. Always plan the trade and trade the plan.

AUD/USD Daily Chart September 5/2019

AUDUSD

Author

Elliott Wave Forecast Team

Elliott Wave Forecast Team

ElliottWave-Forecast.com

More from Elliott Wave Forecast Team
Share:

Editor's Picks

EUR/USD hits two-day highs near 1.1820

EUR/USD picks up pace and reaches two-day tops around 1.1820 at the end of the week. The pair’s move higher comes on the back of renewed weakness in the US Dollar amid growing talk that the Fed could deliver an interest rate cut as early as March. On the docket, the flash US Consumer Sentiment improves to 57.3 in February.

GBP/USD reclaims 1.3600 and above

GBP/USD reverses two straight days of losses, surpassing the key 1.3600 yardstick on Friday. Cable’s rebound comes as the Greenback slips away from two-week highs in response to some profit-taking mood and speculation of Fed rate cuts. In addition, hawkish comments from the BoE’s Pill are also collaborating with the quid’s improvement.

Gold climbs further, focus is back to 45,000

Gold regains upside traction and surpasses the $4,900 mark per troy ounce at the end of the week, shifting its attention to the critical $5,000 region. The move reflects a shift in risk sentiment, driving flows back towards traditional safe haven assets and supporting the yellow metal.

Crypto Today: Bitcoin, Ethereum, XRP rebound amid risk-off, $2.6 billion liquidation wave

Bitcoin edges up above $65,000 at the time of writing on Friday, as dust from the recent macro-triggered sell-off settles. The leading altcoin, Ethereum, hovers above $1,900, but resistance at $2,000 caps the upside. Meanwhile, Ripple has recorded the largest intraday jump among the three assets, up over 10% to $1.35.

Three scenarios for Japanese Yen ahead of snap election

The latest polls point to a dominant win for the ruling bloc at the upcoming Japanese snap election. The larger Sanae Takaichi’s mandate, the more investors fear faster implementation of tax cuts and spending plans. 

XRP rally extends as modest ETF inflows support recovery

Ripple is accelerating its recovery, trading above $1.36 at the time of writing on Friday, as investors adjust their positions following a turbulent week in the broader crypto market. The remittance token is up over 21% from its intraday low of $1.12.