AUD/USD Price Forecast: Inflation data holds the key
- AUD/USD resumed its uptrend and came close to the 0.6800 barrier.
- The Dollar’s knee-jerk bolstered the daily uptick in the Aussie Dollar.
- Markets’ focus is on inflation figures due on August 28.

AUD/USD faltered once again around the key 0.6800 mark on Tuesday, although it managed to cling to decent gains for the day as the US Dollar (USD) suffered the return of sellers to the market.
In the meantime, the pair’s upward momentum remains intact, bolstered by a recent break above the 200-day SMA at 0.6609, which has turned the short-term outlook for AUD/USD bullish.
Even though the pair has rallied for three consecutive weeks, it faces stiff resistance around the 0.6800 level. The ongoing monthly rebound has primarily been driven by the weakening of the Greenback and a broader recovery in risk assets.
Also contributing to gains in the Aussie dollar, copper prices rose to multi-week highs, while iron ore prices moved slightly higher.
Monetary policy developments have also supported the Australian Dollar as of late. The Reserve Bank of Australia (RBA) recently maintained the official cash rate (OCR) at 4.35%, opting for caution with no immediate plans to ease policy due to persistent domestic inflation pressures. Both the trimmed mean and headline CPI inflation are now expected to hit the 2-3% target range by late 2026, later than previously anticipated.
In a subsequent speech, Governor Michelle Bullock reiterated the RBA’s readiness to raise interest rates if necessary to control inflation, maintaining a hawkish stance amid elevated underlying inflation. She stressed the bank’s vigilance regarding inflation risks following the decision to keep rates unchanged. Core inflation, which stood at 3.9% in the last quarter, is expected to reach the 2-3% target range by late 2025.
The bullish sentiment around the AUD has been further supported by the hawkish tone in the RBA Minutes released last week, where members discussed whether to raise the cash rate target or keep it unchanged. The argument for an increase was driven by ongoing underlying inflation and the need to counteract market expectations of multiple rate cuts later in 2024. Ultimately, the members agreed that maintaining the current cash rate target was the best course of action. They also noted that a near-term rate cut is unlikely, though future rate adjustments remain on the table.
Overall, the RBA is expected to be the last among the G10 central banks to begin cutting interest rates.
Expectations of Federal Reserve (Fed) imminent easing have led traders to speculate that the RBA might cut rates at some point in Q4, with the odds at around 50%. However, this decision remains uncertain, as it will depend heavily on upcoming data. The July inflation report, due later this week, is anticipated to show a significant slowdown in headline inflation to 3.4%, down from 3.8%, largely due to government rebates on electricity bills.
Nonetheless, the possibility of rate cuts by the Fed in the near term, contrasted with the RBA’s likely prolonged restrictive stance, should support a stronger AUD/USD in the coming months.
However, the Aussie Dollar’s gains may be limited by a sluggish recovery in the Chinese economy. China continues to struggle with post-pandemic issues such as deflation and inadequate stimulus. Concerns about demand from China, the world’s second-largest economy, were heightened following the Politburo meeting, which, despite promises of support, did not introduce any specific new stimulus measures.
Meanwhile, the latest CFTC report for the week ending August 20 shows that speculators remain largely net-short on the AUD, although they reduced their positions to three-week lows. Net shorts have dominated since Q2 2021, with only a brief two-week break so far this year.
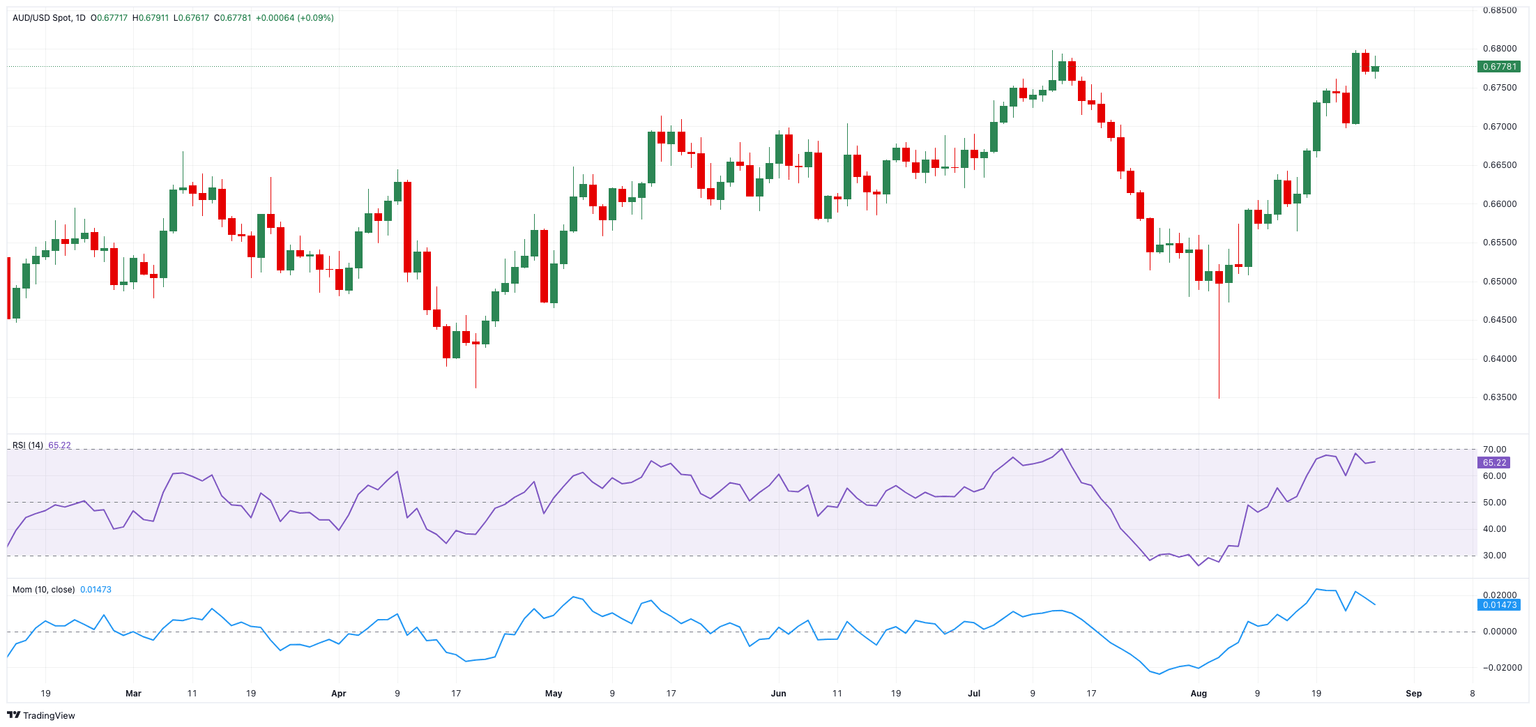
AUD/USD daily chart
AUD/USD short-term technical outlook
Further gains are likely to push the AUD/USD to its August top of 0.6798 (August 23), ahead of the December 2023 peak of 0.6871 (December 28).
Occasional bearish attempts, on the other hand, may result in an initial drop to the temporary 55-day SMA of 0.6652, before the significant 200-day SMA of 0.6609, and the 2024 bottom of 0.6347 (August 5).
The four-hour chart shows the resurgence of some consolidation. That said, the immediate resistance level is 0.6798, ahead of 0.6871. On the other side, 0.6697 is first, followed by the 200-SMA at 0.6637 and then 0.6560. The RSI gyrated around 61.
Premium
You have reached your limit of 3 free articles for this month.
Start your subscription and get access to all our original articles.
Author

Pablo Piovano
FXStreet
Born and bred in Argentina, Pablo has been carrying on with his passion for FX markets and trading since his first college years.


