AUD/USD Price Forecast: Headwinds come from Dollar dynamics and China
- AUD/USD faced fresh selling pressure just above the key 0.6300 barrier.
- The US Dollar remained well bid on the back of firmer US CPI data.
- Chief Powell reiterated its cautious message in his second testimony.

The US Dollar (USD) regained some composure and rose to weekly peaks around the 108.50 region on Wednesday, all in response to firmer-than-expected US inflation data.
On that, AUD/USD rapidly lost momentum, fading two daily gains in a row and coming all the way down to the 0.6235-0.6230 band soon after briefly trespassing the key 0.6300 hurdle.
Trade turbulence and tariff tensions
Despite the ongoing trade drama, the Australian Dollar (AUD) has followed its risk-linked peers higher in past days, although that move seems to have exclusively followed the loss of momentum in the Greenback and steady uncertainty surrounding the White House’s tariff narrative.
Global trade dynamics remain volatile. President Trump’s move to postpone a 25% tariff on Canadian and Mexican imports by one month briefly lifted risk appetite, but new tariff threats quickly reversed this optimism.
Meanwhile, the US imposed a 10% tariff on Chinese imports, sparking fears of retaliation from Beijing. For Australia, China is its largest export market, so potential countermeasures could hit demand for Australian commodities. Beijing is hinting it may challenge these tariffs at the WTO, heightening concerns in resource-exporting countries like Australia.
Inflation, Fed policy, and the road ahead
Though the US Dollar has regained some ground lost last week, the risk of an escalating trade war lingers. If tensions grow, inflation in the US might climb higher, prompting the Federal Reserve (Fed) to maintain interest rates at elevated levels for longer.
In Australia, the spotlight is on the Reserve Bank of Australia (RBA). Inflation appears to be softening—Q4 Consumer Price Index (CPI) data showed a year-over-year rise of 2.5%, down from 2.8% previously. More notably, the trimmed mean CPI, a key RBA measure, fell to a three-year low of 3.2%. This has fueled speculation of a 25 basis point rate cut at the upcoming February 18 meeting, with further cuts possible over the next year.
Commodities offer mixed support
On the commodities front, concerns about weaker Chinese demand usually weigh on Australian exports such as iron ore and copper. While these commodities remain central to Australia’s economy, their prices remain in the upper end of the yearly range so far, which could limit the extend of occasional bouts of selling pressure.
Technical snapshot
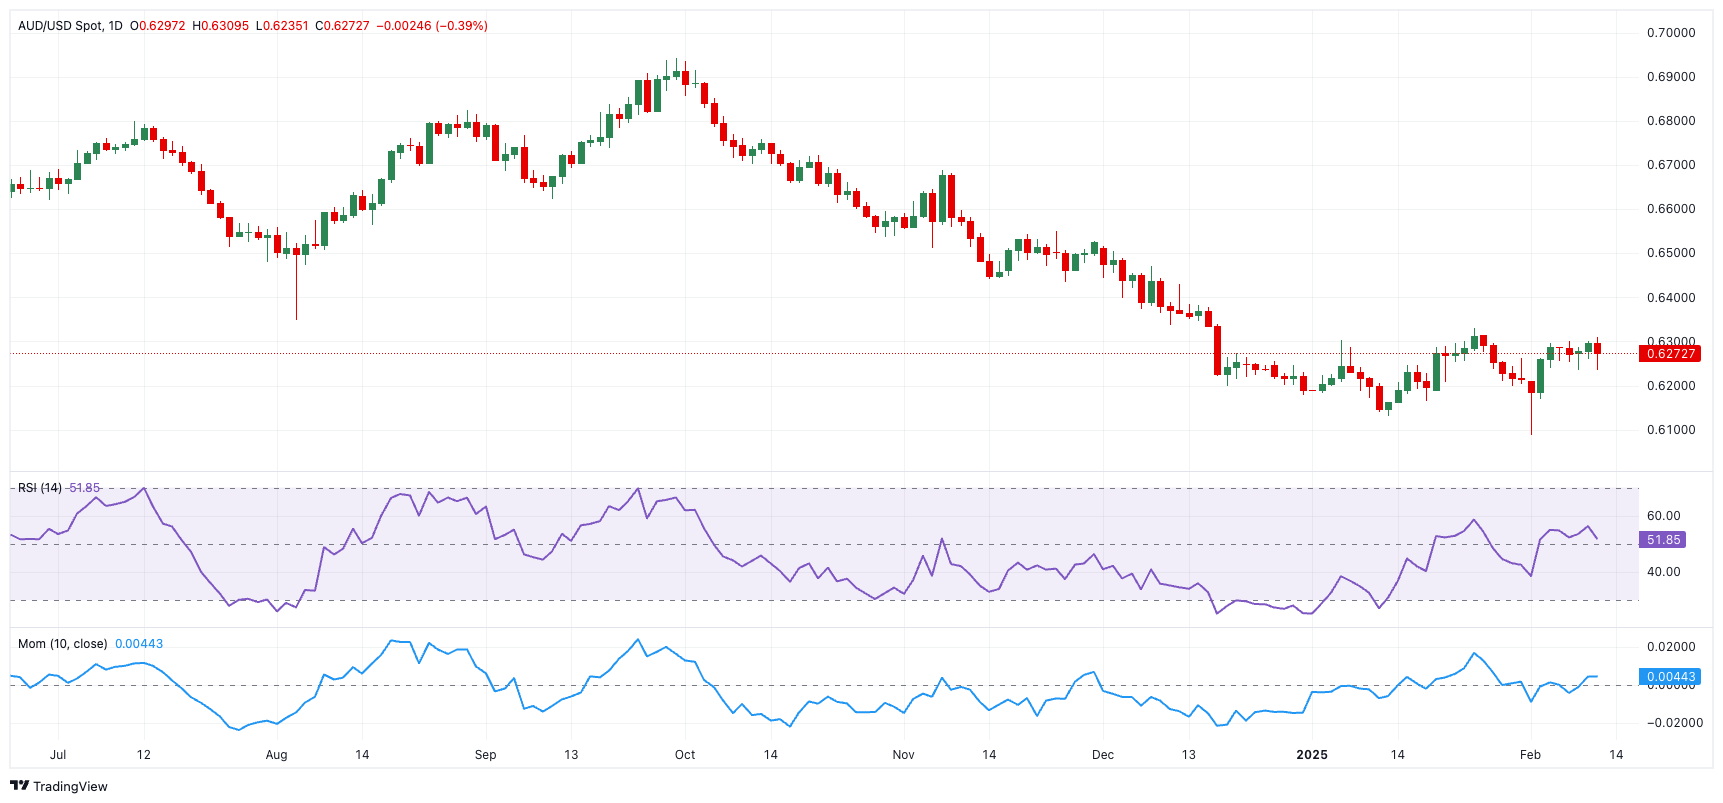
For AUD/USD, 0.6087 remains a critical support level—the lowest point recorded this year. A decisive break below that could see the pair quickly target 0.6000. On the upside, resistance lies at the yearly peak of 0.6330, seconded by the transitory 100-day SMA at 0.6457, and 0.6549 (the weekly high from November 25).
Technical indicators are sending mixed signals: the Relative Strength Index (RSI) has eased below 49, but the Average Directional Index (ADX) has declined to about 18, indicating the trend may be losing strength.
AUD/USD daily chart
What’s Next?
Looking ahead, Australia’s economic calendar features the Melbourne Institute’s Consumer Inflation Expectations on February 14.
Premium
You have reached your limit of 3 free articles for this month.
Start your subscription and get access to all our original articles.
Author

Pablo Piovano
FXStreet
Born and bred in Argentina, Pablo has been carrying on with his passion for FX markets and trading since his first college years.


