AUD/USD Price Forecast: Extra losses appear in the pipeline
- AUD/USD remained under persistent pressure in the low 0.6600s.
- The US Dollar faced some profit taking and a mild bounce in the risk complex.
- The critical 200-day SMA continues to hold the downside.

AUD/USD remained well on the defensive on Thursday, adding to Wednesday’s retracement and revisiting the area of recent lows around 0.6620, an area which is also underpinned by the significant 200-day simple moving average (SMA).
The Australian dollar's weakness came despite a lacklustre performance of the US Dollar (USD) derived from some profit-taking and a broad-based tepid recovery in the risk-associated galaxy. In addition, steady scepticism surrounding the implementation of the recently announced Chinese stimulus measures also kept the Aussie on the back foot.
Contributing to the pair’s decline emerged a significant drop in copper prices, which contrasted with slight gains in iron ore prices, all highlighting the traders’ mixed sentiment regarding China's economic outlook.
On the monetary side, the Reserve Bank of Australia (RBA) held its cash rate at 4.35% during its September meeting. Although Governor Michele Bullock recognised inflationary risks, she downplayed the likelihood of a near-term rate hike.
Minutes from the meeting revealed a more dovish stance compared to August, signalling that rates could remain steady for a while. Market sentiment currently suggests a 50% chance of a 25 basis point rate cut by year-end, with the RBA expected to be among the last G10 central banks to lower rates in response to cooling economic growth and inflation.
However, in his latest remarks, Deputy Governor Andrew Hauser cautioned that expectations for significant RBA easing might be too high, noting that Australian rates may not fall as much or as quickly as other central banks due to persistent inflationary pressures. Hauser also highlighted that the RBA models estimate the neutral rate between 3% and 4%, meaning the current rate of 4.35% is not excessively restrictive.
While possible rate cuts by the Federal Reserve later this year could lend support to the AUD/USD pair, uncertainties surrounding China’s economic outlook remain a concern.
In Australia, results in the business activity came in mixed after the flash Judo Bank Manufacturing and Services PMIs were seen at 46.6 and 50.6, respectively, in October.
AUD/USD daily chart
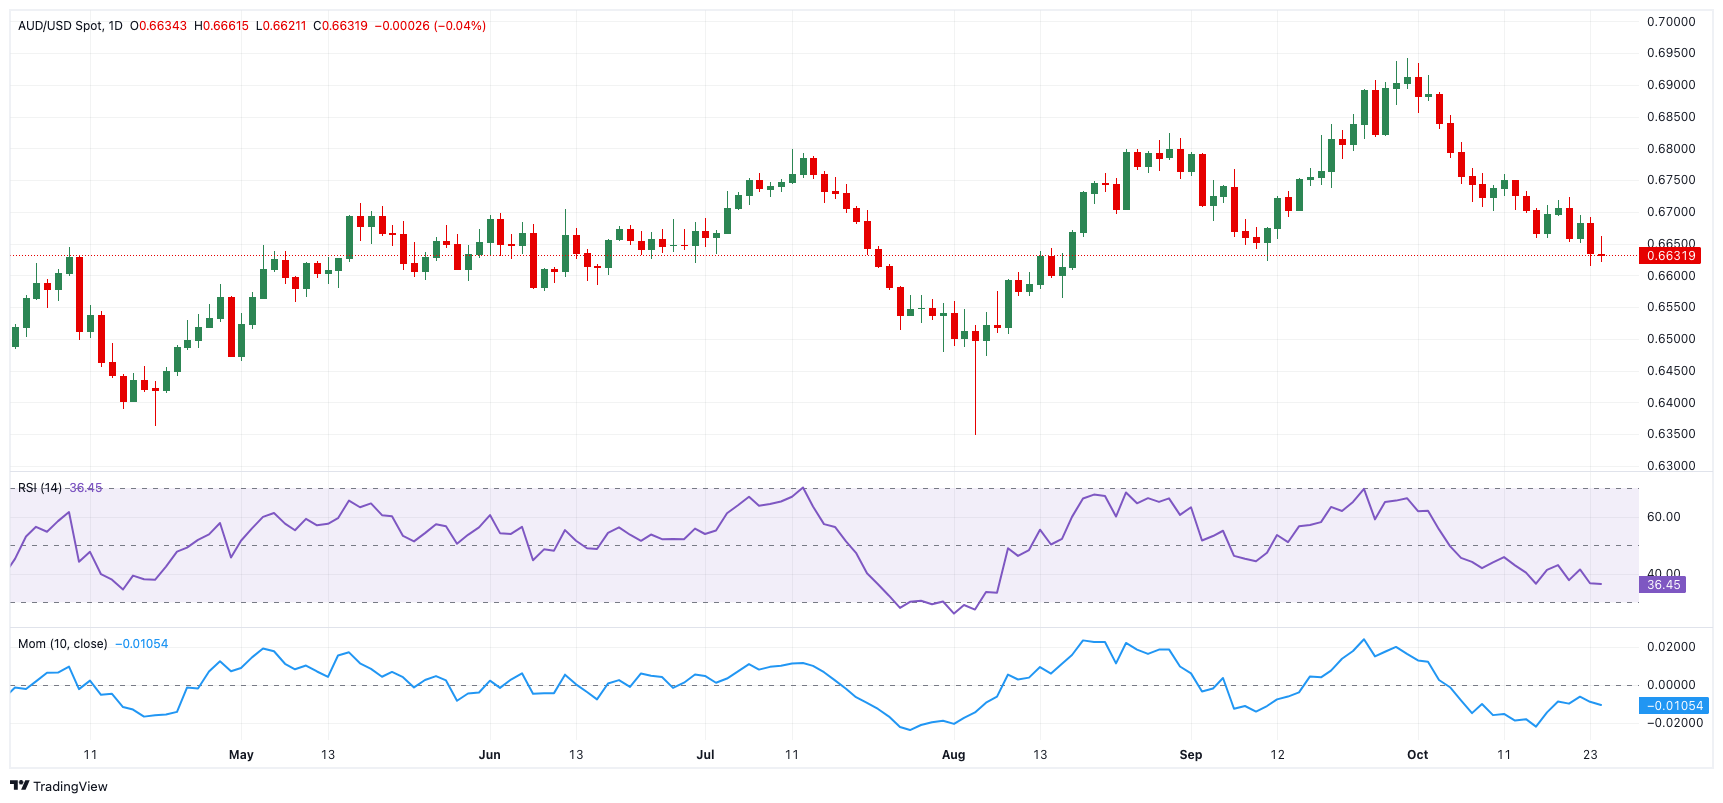
AUD/USD short-term technical outlook
Extra losses might push the AUD/USD to its October low of 0.6613 (October 23), ahead of the 2024 bottom of 0.6347 (August 5).
On the upside, there is an interim obstacle at the 55-day SMA of 0.6739 before reaching the 2024 peak of 0.6942 (September 30) and the key 0.7000 barrier.
The four-hour chart indicates that the negative leg remains well in place. That said, initial support is at 0.6613, followed by 0.6560 and 0.6347. On the upswing, the first resistance level is the 55-SMA at 0.6688, seconded by 0.6723 and the 200-SMA at 0.6762. The RSI fell to around 36.
Premium
You have reached your limit of 3 free articles for this month.
Start your subscription and get access to all our original articles.
Author

Pablo Piovano
FXStreet
Born and bred in Argentina, Pablo has been carrying on with his passion for FX markets and trading since his first college years.


