AUD/USD is floating above the 6712 support level after hitting a new yearly low yesterday
-
The Australian currency trades close to its 2022 low.
-
The Moving Average indicator encourages more decline.

After reaching its yearly low of 6681, the Australian dollar rallied by approximately 80 pips en route to 6761. Nonetheless, the Australian Dollar paused following a rejection at the 6761 level. At the time of publication, the AUD/USD was trading at 6743, -0.0002, or -0.341% for the day.
This analysis relies on four-hour time frame
The AUD/USD pair has continued to decline since the high reached in early April of this year. In the early hours of yesterday's New York session, the Australian dollar reached a new annual low. In addition, the current Moving Average Indicator reading implies additional downside in the near future. The 100-MA crosses beneath the 200-MA, while the 50-MA also crosses beneath the 100-MA. The Relative Strength Index, on the other hand, stops in a natural zone and registers 51 on the value line, requiring momentum in the down or up direction to reinforce any direction patination.
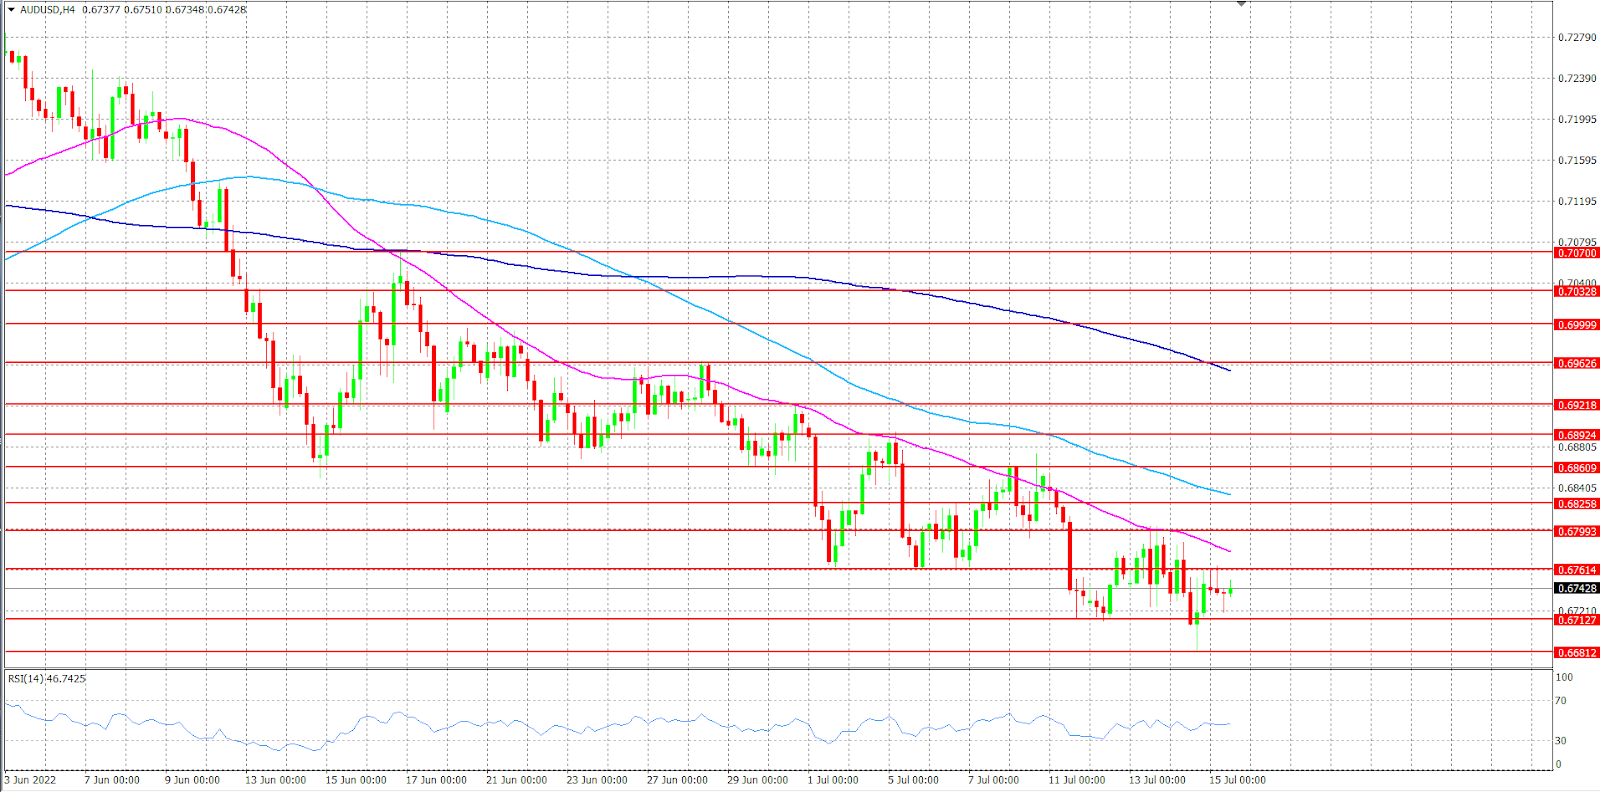
In the four-hour timeframe, the Aud/USD found a shutter in the neighborhood of 6712–6761. However, the doors are still open in both directions. In the meantime, the technical reading makes the downside scenario more likely to occur. In consonance, if the resistance level of 6761 can prevent the Aussie from making more gains that may push the price back towards the 6712 support level. If the price falls below the aforementioned level, that would open the door towards yesterday's and the yearly low of 6681. A successful closing below that level would reveal the number last seen on June 1, 2020.
Alternatively, if the Australian dollar wants to abandon the bearish scenario, then it must surpass the 6761 resistance level, a decisive break of that level that would pave the way towards 6799. If the price could close above the previously mentioned level, it would encourage the Aussie to encounter the resistance level of 6825, followed by the resistance level of 6860.
Note: When a resistance level is broken, it becomes a support level since the price will trade above it, and vice versa. Alternatively, the market may perform a false breakout or rebound after breaking support, or vice versa. Additionally, the market could bounce from any level of support or decline after breaking any level of resistance.
Author

Mohammad Quqas
Independent Analyst
Mohammad Quqas has a bachelor's degree in finance and banking. He has been trading forex for years, which has given him expertise in working with foreign currencies, commodities, and indices.


