AUD/USD Forecast: Extra downside not ruled out near term
- AUD/USD resumed the decline and retreats below 0.6500.
- The recovery in the greenback put the AUD under pressure.
- Inflation Rate in China surprised to the downside.

The Australian dollar came under renewed selling pressure amidst the solid performance in the Greenback on Thursday.
Indeed, the greenback set aside two daily declines in a row and reclaimed the area north of 104.00 the figure when gauged by the USD Index (DXY). This rebound occurred amid steady investor speculation about a potential interest rate cut by the Federal Reserve (Fed) in either May or June.
Turning to domestic factors, the AUD’s weakness remained propped up by the generalized bearish trend in the commodity complex, where copper prices and iron ore extended further their retracements.
Also weighing on the Aussie Dollar emerged another lower-than-expected inflation figures in China in the first month of the year.
In the meantime, market participants continued to evaluate the Reserve Bank of Australia's (RBA) latest interest rate decision, which kept rates unchanged at 4.35% while delivering a hawkish message that left a potential future rate hike in the pipeline for the time being.
Still around the RBA and its Statement on Monetary Policy (SoMP), the bank slightly lowered its inflation forecasts, anticipating both metrics to remain below 3% by the fourth quarter of 2025. Additionally, the RBA revised down its GDP growth projections, reflecting a less optimistic outlook for consumer spending and housing investments in the near term.
Governor Bullock's departure from the expected move towards a dovish stance further tempered the pair's upward potential. She emphasized the incomplete nature of addressing inflation and highlighted the current inflation rate as unacceptably high.
AUD/USD daily chart
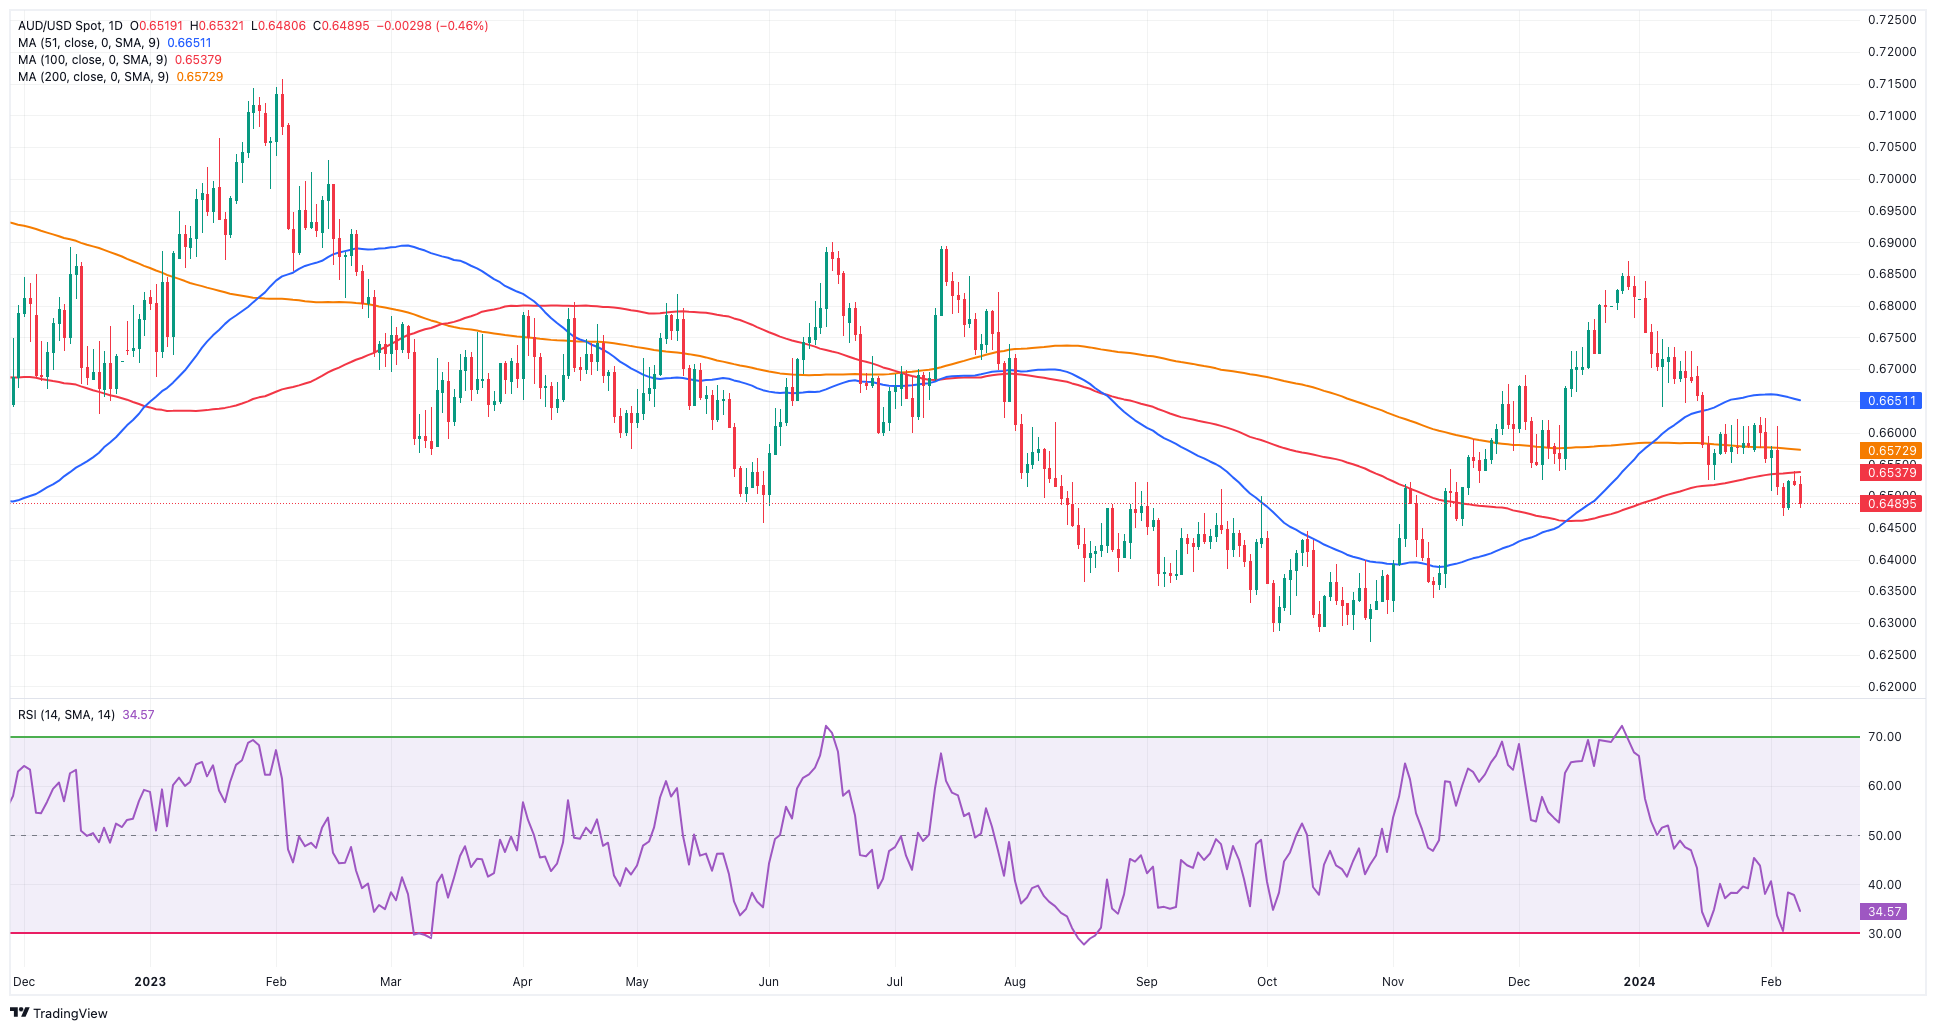
AUD/USD short-term technical outlook
Further losses in the AUD/USD should pass its 2024 level of 0.6468 (February 5), setting up a potential test of the 2023 low of 0.6270 (Oct 26). The breach of the latter may result in a move to the round level of 0.6200 before the 2022 low of 0.6169 (October 13).
On the upside, the key 200-day SMA at 0.6571 is ahead of the intermediate 55-day SMA at 0.6642. The breakout of this zone may push the pair to attempt the December 2023 top of 0.6871 (December 28), followed by the July 2023 peak of 0.6894 (July 14) and the June 2023 high of 0.6899 (June 16), all right before the key 0.7000 threshold.
The 4-hour chart turned bearish, paving the way for a dip to 0.6452 once 0.6468 is cleared. On the bullish side, 0.6610 is an immediate hurdle ahead of the 200-SMA at 0.6650. The surpassing of this zone indicates a possible progress to 0.6728. The MACD remains well in the negative zone, and the RSI deflated to the 36 zone.
Premium
You have reached your limit of 3 free articles for this month.
Start your subscription and get access to all our original articles.
Author

Pablo Piovano
FXStreet
Born and bred in Argentina, Pablo has been carrying on with his passion for FX markets and trading since his first college years.


