AUD/USD Forecast: Decent resistance aligns above 0.6700
- AUD/USD dropped to multi-day lows near 0.6630.
- Further gains in the Dollar kept AUD under pressure.
- Australian Consumer Inflation Expectations are due next.

Another decent rebound in the US Dollar (USD) led to renewed selling pressure on risky assets, causing AUD/USD to retreat for the third straight session and clinch five-day lows in the 0.6635–0.6630 band on Wednesday.
Additionally, the USD attracted fresh buying interest as investors continued to process expectations that the Federal Reserve (Fed) might begin its easing programme later in the year, likely at the September meeting.
Supporting the above remained the steady, cautious tone of many Fed officials, who continued to adhere to the idea that further conviction that inflation is headed towards the bank’s target is needed before starting to reduce rates.
Domestically, the Australian Dollar also derived selling interest in response to the marked pullback in copper prices following recent fresh peaks contrasting with the relatively stable iron ore prices.
In terms of monetary policy, the Reserve Bank of Australia (RBA) kept its interest rate steady at 4.35% this month, maintaining a neutral stance and signalling flexibility. The RBA's economic projections suggest that inflation will remain elevated until Q2 2025, driven by service price inflation, before returning to the 2%–3% target range by late 2025 and reaching the midpoint by 2026. So far, investors see the RBA keeping its OCR unchanged at its June 18 event.
Both the RBA and the Federal Reserve are expected to implement easing measures later than many of their G10 counterparts.
Given the Fed's commitment to monetary policy tightening and the potential for RBA easing later in the year, sustained upward movements in AUD/USD are likely to face limitations.
AUD/USD daily chart
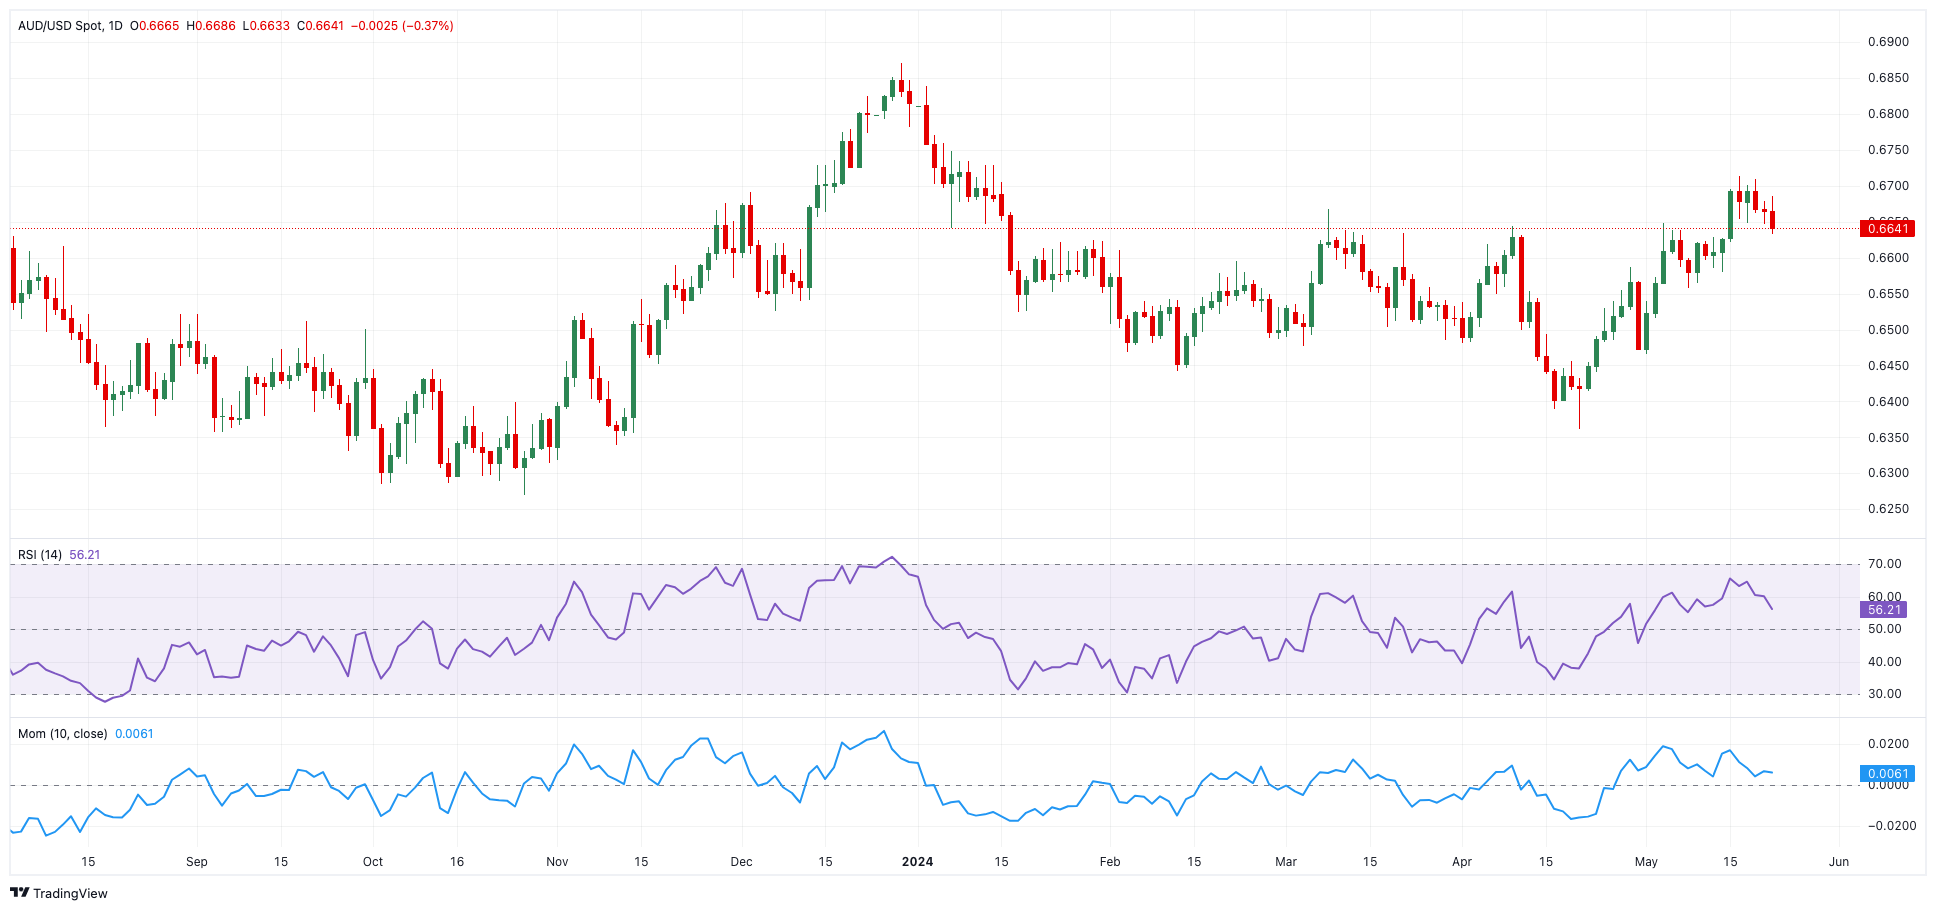
AUD/USD short-term technical outlook
Extra gains may enable the AUD/USD to first test the May high of 0.6714 (May 16) before challenging the December 2023 top of 0.6871 and the July 2023 peak of 0.6894 (July 14), all ahead of the important 0.7000 level.
Meanwhile, bearish attempts may drag the pair to the interim 100-day and 55-day SMAs in the 0.6560 region before the more important 200-day SMA of 0.6525, all before falling to the May low of 0.6465 and the 2024 bottom of 0.6362 (April 19).
Looking at the bigger picture, additional gains are probable as long as the spot remains above the 200-day SMA.
On the four-hour chart, the selling momentum appears to be regaining strength. However, early resistance emerges at 0.6714 before 0.6871. On the downside, 0.6632 provides immediate support, just ahead of the 100-SMA at 0.6611. The RSI decreased to around 40.
Premium
You have reached your limit of 3 free articles for this month.
Start your subscription and get access to all our original articles.
Author

Pablo Piovano
FXStreet
Born and bred in Argentina, Pablo has been carrying on with his passion for FX markets and trading since his first college years.


