AUD/USD Forecast: Attention shifts back to 0.6700
- AUD/USD reversed three consecutive daily pullbacks on Thursday.
- The muted price action in the US Dollar supported the pair's bounce.
- Australia's trade surplus widened more than expected in April.

The marginal decline in the US Dollar (USD) seems to have been enough to spark a strong rebound in AUD/USD on Thursday, which reclaimed the area around 0.6660, or two-day highs.
The greenback's losses followed rising prudence ahead of the release of US Payrolls on Friday, while further cooling of the US labour market maintained speculation that a rate cut by the Fed in September still remains on the table, despite it looking like a "long shot" for the time being.
In addition to the Dollar's pullback, the Aussie dollar's rebound was also driven by another positive session in copper prices vs. persistent weakness in iron ore prices.
On the monetary policy front, the Reserve Bank of Australia (RBA), like the Fed, may be among the last major central banks to adjust its policy. According to the bank's latest Minutes, officials even considered the possibility of interest rate hikes if inflation accelerates.
Currently, money markets are predicting about a 25 bps easing by May 2025, with potential rate hikes still on the table for August. Bolstering the latter, the RBA's Monthly CPI Indicator (Weighted Mean CPI) increased more than expected in April, rising to 3.6% from 3.5%.
Given the Fed's commitment to tightening and the likelihood that the RBA will maintain its restrictive stance for an extended period, AUD/USD is expected to consolidate further in the coming months.
AUD/USD daily chart
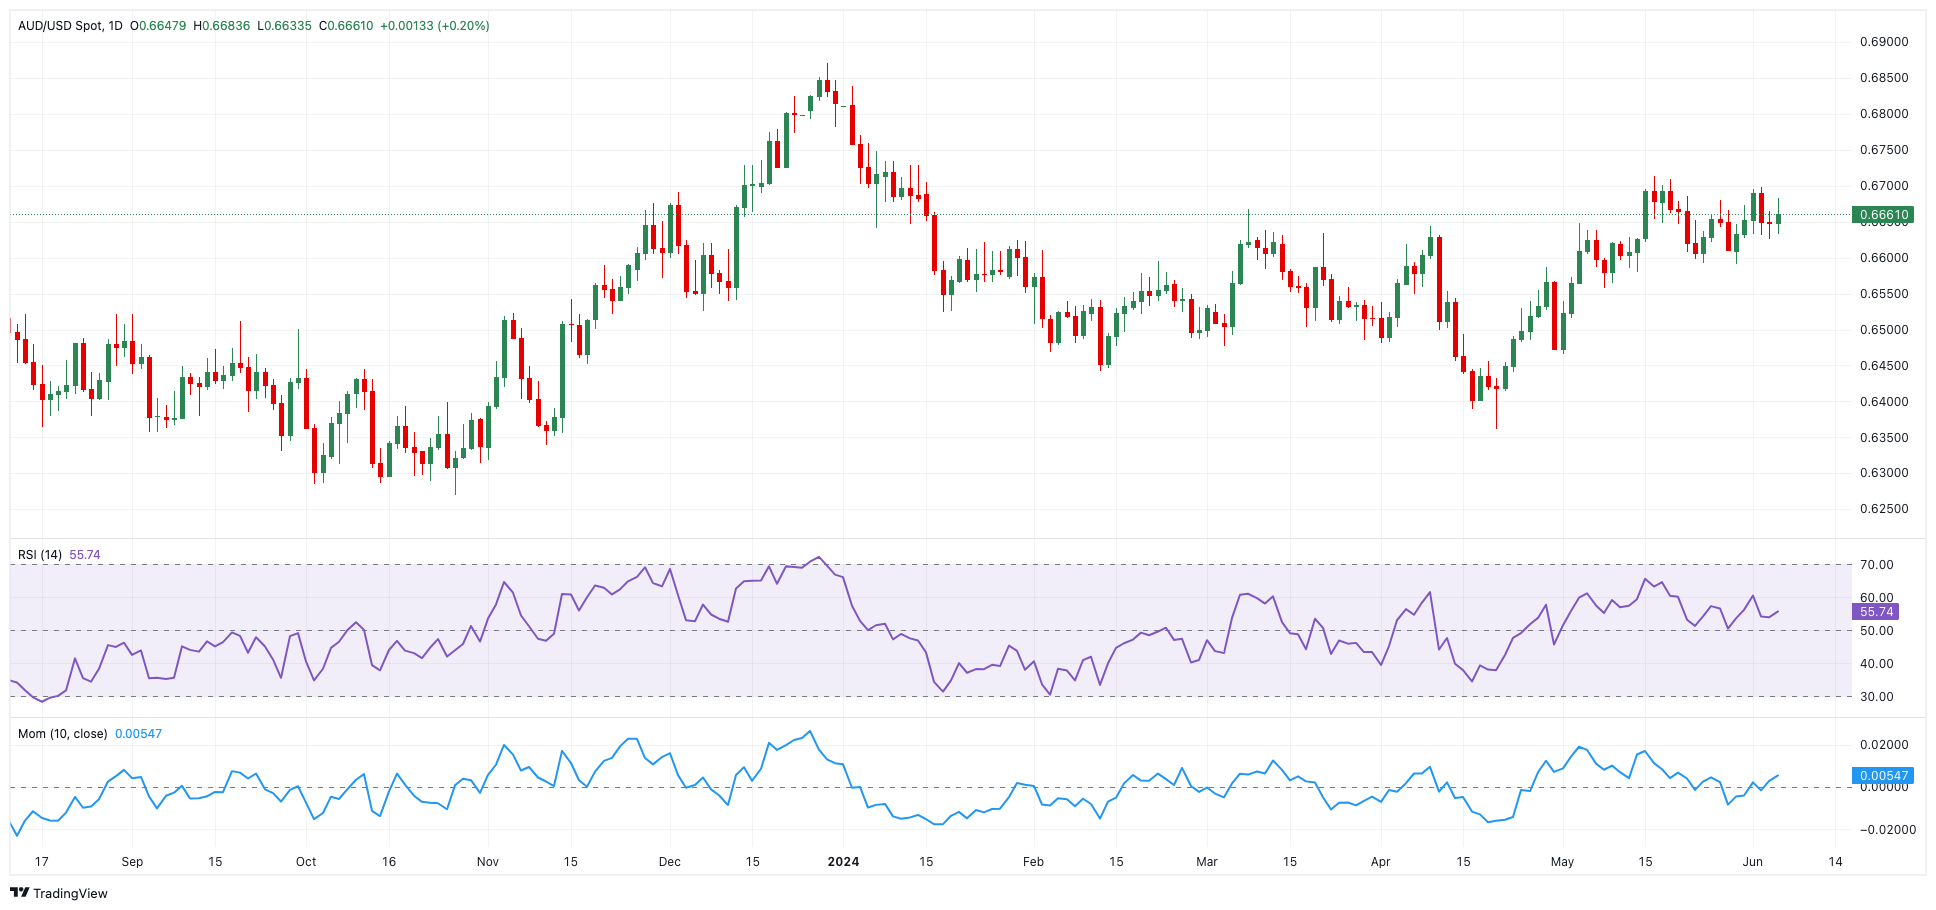
AUD/USD short-term technical outlook
Extra gains may push the AUD/USD to the May peak of 0.6714 (May 16), followed by the December 2023 high of 0.6871 and the July 2023 top of 0.6894 (July 14), all ahead of the critical 0.7000 level.
Meanwhile, bearish attempts may push the pair towards the intermediate 100-day and 55-day SMAs in the 0.6560-0.6570 range, followed by the key 200-day SMA at 0.6537. The loss of the latter might lead to a return to the May low of 0.6465 and the 2024 bottom of 0.6362 (April 19).
Overall, greater gains are likely as long as the price remains above the 200-day moving average.
The 4-hour chart shows that the consolidative range remains well in place. Nonetheless, 0.6698 is the initial upward barrier, followed by 0.6709 and 0.6714. On the other hand, the 200-SMA of 0.6604 comes first ahead of 0.6590 and 0.6557. The RSI climbed past 53.
Premium
You have reached your limit of 3 free articles for this month.
Start your subscription and get access to all our original articles.
Author

Pablo Piovano
FXStreet
Born and bred in Argentina, Pablo has been carrying on with his passion for FX markets and trading since his first college years.


