AUD/USD Forecast: All the attention remains on inflation prints
- AUD/USD lost the 0.6700 mark on Tuesday.
- A deeper pullback could see the 200-day SMA revisited.
- Investors’ focus shifts to key inflation data on Wednesday.

The decent rebound in the greenback put the broader risk-associated universe under extra downside pressure on turnaround Tuesday, exposing the Aussie dollar to extra weakness.
Against that backdrop, AUD/USD broke below the key 0.6700 contention zone and seems to have paved the way for another potential test of the support region near 0.6650, or yearly lows.
In the meantime, cautious trade is expected to emerge around AUD ahead of the publication of key inflation readings gauged by the Monthly CPI Indicator by the RBA. So far, consensus points to another soft print from domestic inflation, which should in turn support the idea of a pause by the RBA in a context where the central bank has not ruled out extra interest rate hikes.
Sport also derived further selling pressure from another poor session in the commodity galaxy, where copper prices and iron ore extended their negative activity, while the absence of inspiring news from China is expected to keep the Australian currency under scrutiny.
A quick look at the domestic calendar saw flash Building Permits expanding at a monthly 1.6% in November, while preliminary readings showed Retail Sales increasing by 2.0% in November vs. the previous month.
AUD/USD daily chart
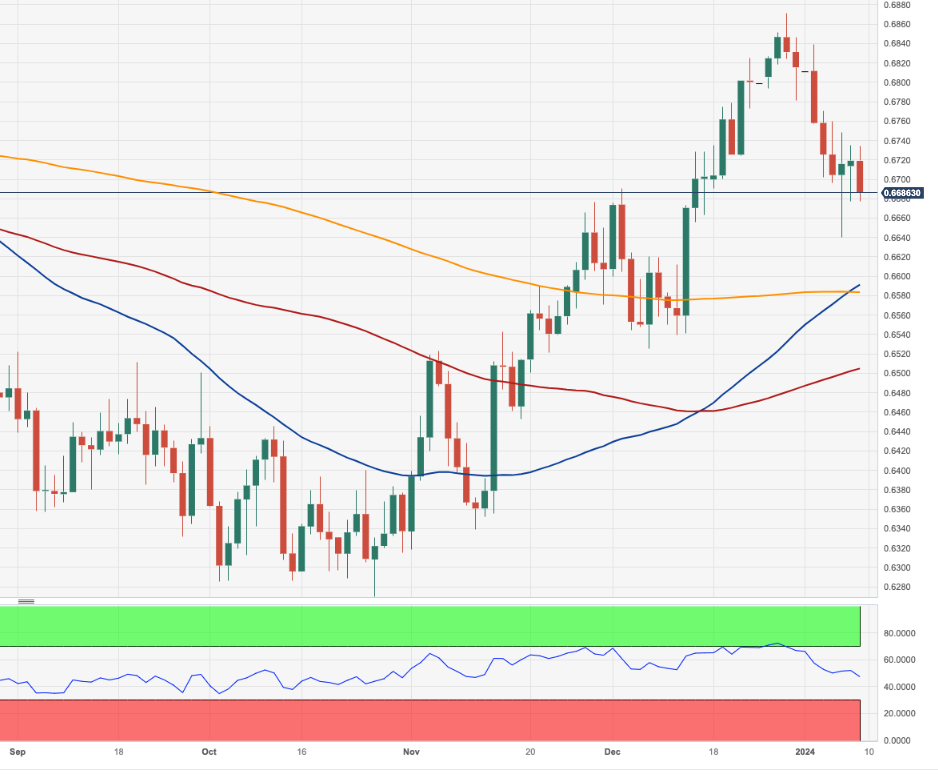
AUD/USD short-term technical outlook
Further AUD/USD weakness might reach the 2024 low of 0.6640 (January 5) before the critical 200-day SMA at 0.6582. Down from here is the December 2023 low of 0.6525 prior to the interim 100-day SMA at 0.6500. If bulls recover control, the focus will transfer to the December 2023 high of 0.6871 (December 28), which will appear before the July 2023 top of 0.6894 (July 14) and the June peak of 0.6899 (June 16). If the pair breaks out of this range, the psychological 0.7000 level will be the next to watch.
According to the 4-hour chart, the significant conflict zone is around 0.6650. If this zone is breached, there are no noteworthy disagreement levels until 0.6525 and 0.6452. The MACD sank to the negative zone, while the RSI trading below 50 all seem to point to further losses in the short-term horizon. The bullish trend, on the other hand, may encounter first resistance at the 55-SMA at 0.6766, which is seen as the last line of defence before the previous high at 0.6870.
Premium
You have reached your limit of 3 free articles for this month.
Start your subscription and get access to all our original articles.
Author

Pablo Piovano
FXStreet
Born and bred in Argentina, Pablo has been carrying on with his passion for FX markets and trading since his first college years.


