AUD/USD Elliott Wave technical analysis [Video]
![AUD/USD Elliott Wave technical analysis [Video]](https://editorial.fxstreet.com/images/Markets/Currencies/Majors/AUDUSD/australian-currency-23690700_XtraLarge.jpg)
AUD/USD Elliott Wave technical analysis
-
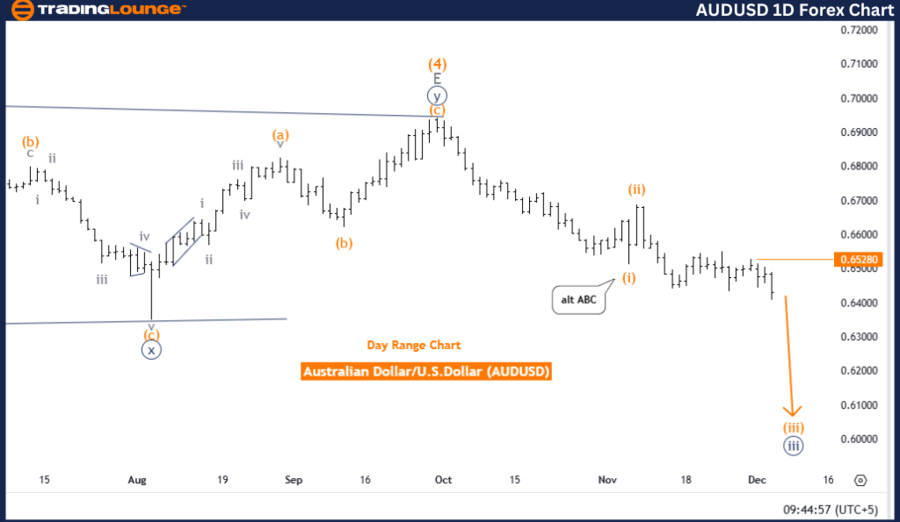
Function: Bearish Trend.
-
Mode: Impulsive.
-
Structure: Orange Wave 3.
-
Position: Navy Blue Wave 3.
-
Direction next lower degrees: Orange Wave 3 (started).
-
Details: Orange Wave 2 appears to be completed; orange wave 3 is now active.
-
Wave cancel invalidation level: 0.65280.
The AUD/USD daily chart reflects an Elliott Wave analysis indicating a bearish trend. The current wave structure is identified as orange wave 3, forming part of a larger impulsive sequence within navy blue wave 3.
Based on the analysis, orange wave 2 appears to have concluded, marking the beginning of orange wave 3. This progression is consistent with the Elliott Wave Theory, which identifies cyclical wave patterns to forecast market movements. The ongoing orange wave 3 aligns with the broader bearish outlook, showcasing continued downward momentum.
A critical invalidation level for this wave count is set at 0.65280. A move above this level would necessitate a reevaluation of the current wave structure, suggesting a potential shift in the expected bearish pattern.
This analysis provides traders with a comprehensive view of the market's directional trend. It emphasizes significant levels and highlights the impulsive nature of the ongoing wave, offering valuable insights into the continued bearish momentum likely in the coming days.
AUD/USD Elliott Wave technical analysis
-
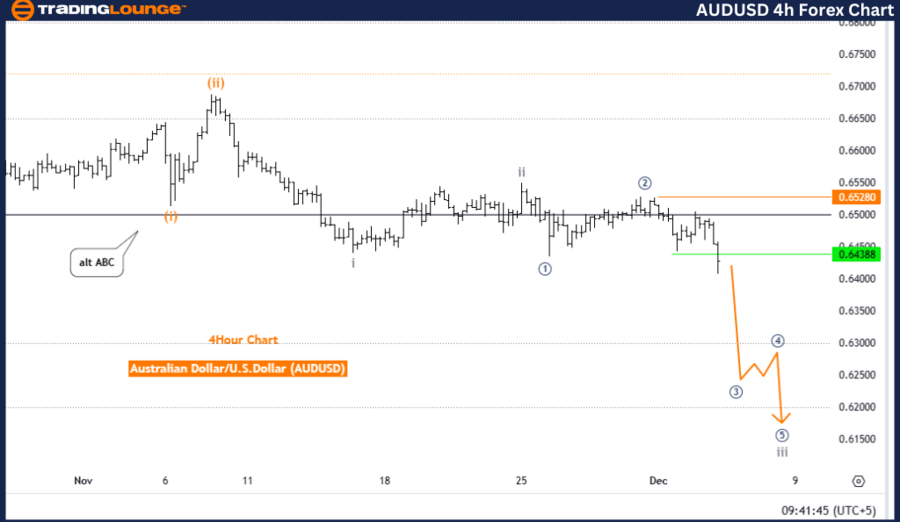
Function: Bearish Trend.
-
Mode: Impulsive.
-
Structure: Gray Wave 3.
-
Position: Orange Wave 3.
-
Direction next lower degrees: Gray Wave 3 (started).
-
Details: Gray Wave 2 appears to have completed; Gray Wave 3 is now active.
-
Wave cancel invalidation level: 0.65533.
The AUD/USD 4-hour chart reflects an Elliott Wave analysis indicating a bearish trend. The current wave structure is identified as gray wave 3, progressing within an impulsive sequence. Within this broader framework, orange wave 3 is currently active, signifying the continuation of the downward trend.
According to the analysis, gray wave 2 has likely concluded, paving the way for the development of gray wave 3. This aligns with the principles of Elliott Wave Theory, which is utilized to identify repetitive wave patterns for market trend predictions. The ongoing bearish momentum demonstrates the impulsive characteristics of this wave, with further downside anticipated.
A critical invalidation level for this wave count is set at 0.65533. A movement above this level would require a reassessment of the current wave structure, indicating a potential deviation from the expected bearish scenario.
This analysis provides traders with a structured approach to understanding the prevailing market dynamics. It emphasizes significant levels and directional trends, delivering insights into the continuation of bearish momentum in the short term.
AUD/USD Elliott Wave technical analysis [Video]
Author

Peter Mathers
TradingLounge
Peter Mathers started actively trading in 1982. He began his career at Hoei and Shoin, a Japanese futures trading company.


