AUD/USD Elliott Wave technical analysis [Video]
![AUD/USD Elliott Wave technical analysis [Video]](https://editorial.fxstreet.com/images/Markets/Currencies/Majors/AUDUSD/stack-of-australian-dollar-29363314_XtraLarge.jpg)
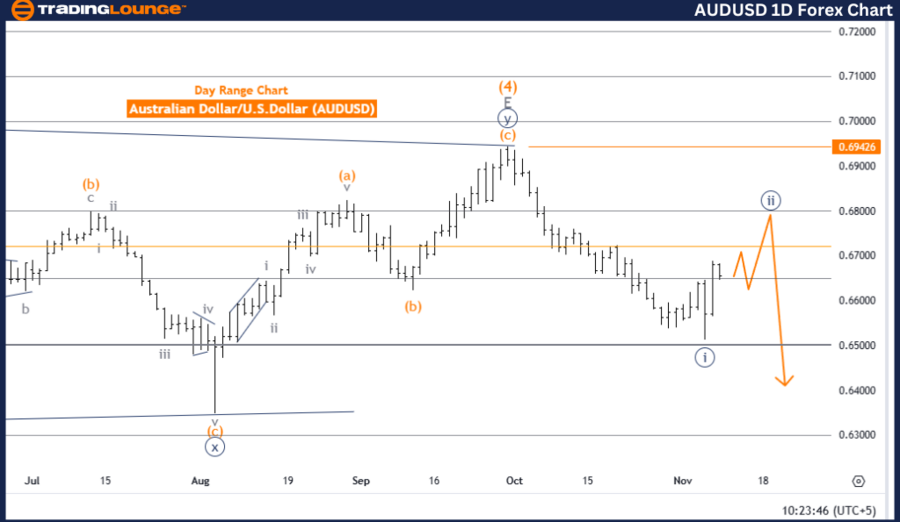
Australian Dollar/U.S. Dollar (AUDUSD) Day Chart
AUD/USD Elliott Wave technical analysis
-
Function: Counter Trend.
-
Mode: Corrective.
-
Structure: Navy Blue Wave 2.
-
Position: Gray Wave 1.
-
Direction next lower degrees: Navy Blue Wave 3.
-
Details: Navy Blue Wave 1 appears complete, with Navy Blue Wave 2 now unfolding.
-
Wave cancel invalid level: 0.69426.
The AUDUSD Day Chart Elliott Wave analysis illustrates a counter-trend phase within a corrective mode, presently manifesting in Navy Blue Wave 2. Following the conclusion of Navy Blue Wave 1, which indicated a downward movement, the chart now presents a temporary corrective period within Navy Blue Wave 2. This phase usually aligns with minor upward retracements, pausing the dominant downtrend before potentially resuming with Navy Blue Wave 3.
As Navy Blue Wave 2 is corrective, it suggests short-term consolidation or slight upward movement countering the prevailing downtrend set by Navy Blue Wave 1. This stage provides an opportunity for some price stabilization or recovery prior to a potential continuation of the primary bearish trend. Such counter-trend activity is typical in corrective waves, implying that while the main trend is likely to continue downward, temporary pullbacks may occur within the correction.
An invalidation level has been set at 0.69426, marking a critical threshold for the corrective pattern. Exceeding this level would invalidate the current wave structure and require a reassessment of the wave count. This invalidation point is a key reference for evaluating the durability of the ongoing corrective wave.
In summary
The AUDUSD Day Chart analysis for Navy Blue Wave 2 signals a temporary corrective stage following the downward trend of Navy Blue Wave 1. This corrective mode indicates a counter-trend movement that allows for potential upward retracement within the broader bearish trend. The 0.69426 invalidation level is crucial for confirming the wave structure, as breaching it would nullify the present wave analysis. Once the current corrective phase concludes, a likely continuation of the downtrend in Navy Blue Wave 3 is expected.
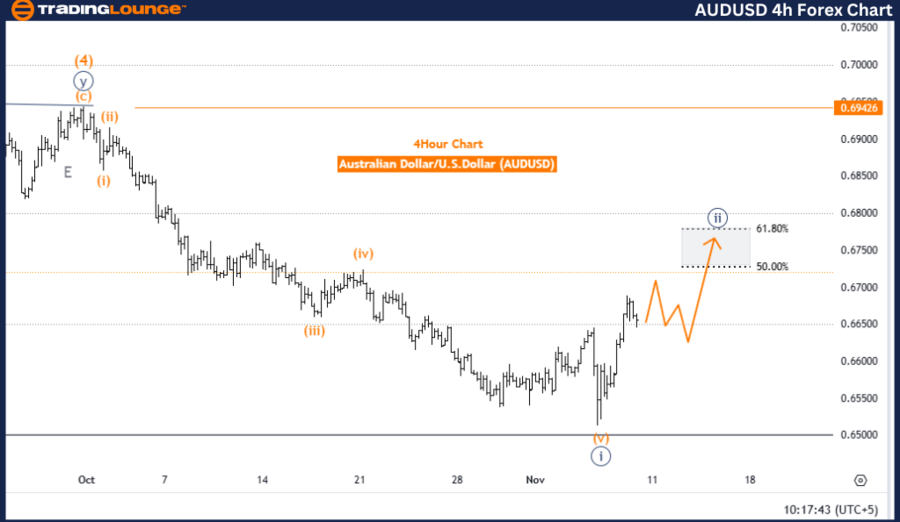
Australian Dollar/U.S. Dollar (AUDUSD) 4 Hour Chart
AUD/USD Elliott Wave technical analysis
-
Function: Counter Trend.
-
Mode: Corrective.
-
Structure: Navy Blue Wave 2.
-
Position: Gray Wave 1.
-
Direction next lower degrees: Navy Blue Wave 3.
-
Details: Navy Blue Wave 1 appears complete, with Navy Blue Wave 2 now in play.
-
Wave cancel invalid level: 0.69426.
The 4-hour Elliott Wave analysis for the AUD/USD pair highlights a counter-trend movement within a corrective mode, currently unfolding as Navy Blue Wave 2. After completing Navy Blue Wave 1, which established a downward trend, the chart now points to a correction phase within Navy Blue Wave 2, suggesting a temporary pause or potential reversal in the larger trend. This phase implies a period of consolidation or slight upward movement before possibly resuming the downtrend in Navy Blue Wave 3.
Navy Blue Wave 2 acts as a retracement against the dominant downtrend initiated by Navy Blue Wave 1. This corrective phase often signals a reassessment by market participants, which could offer short-term relief to the prevailing downtrend. The corrective nature of this phase aligns with a temporary counter-trend movement rather than a full reversal of the primary trend direction.
An invalidation level is established at 0.69426, serving as a crucial boundary to maintain the current wave structure. Should prices move above this level, it would invalidate the existing pattern and likely require a revision of the Elliott Wave count. This threshold functions as a protective marker, ensuring that Navy Blue Wave 2's corrective structure remains intact without disrupting the larger trend.
In summary
The 4-hour Elliott Wave analysis for AUDUSD indicates a corrective counter-trend phase within Navy Blue Wave 2, following the completion of Navy Blue Wave 1’s downtrend. This corrective mode suggests a short-term pause in the broader bearish trend, with potential upward movement limited by the invalidation level of 0.69426. This setup implies that AUDUSD may resume its downward trend after the completion of the current corrective phase, provided the invalidation level remains unbreached.
AUD/USD Elliott Wave technical analysis [Video]
Author

Peter Mathers
TradingLounge
Peter Mathers started actively trading in 1982. He began his career at Hoei and Shoin, a Japanese futures trading company.


