AUD/USD Elliott Wave technical analysis [Video]
![AUD/USD Elliott Wave technical analysis [Video]](https://editorial.fxstreet.com/images/Markets/Currencies/Majors/AUDUSD/australian-money-36572798_XtraLarge.jpg)
AUD/USD Elliott Wave technical analysis
-
Function: Bearish Trend.
-
Mode: Impulsive.
-
Structure: Navy Blue Wave 1.
-
Position: Gray Wave 1.
-
Direction next higher degrees: Navy Blue Wave 2.
-
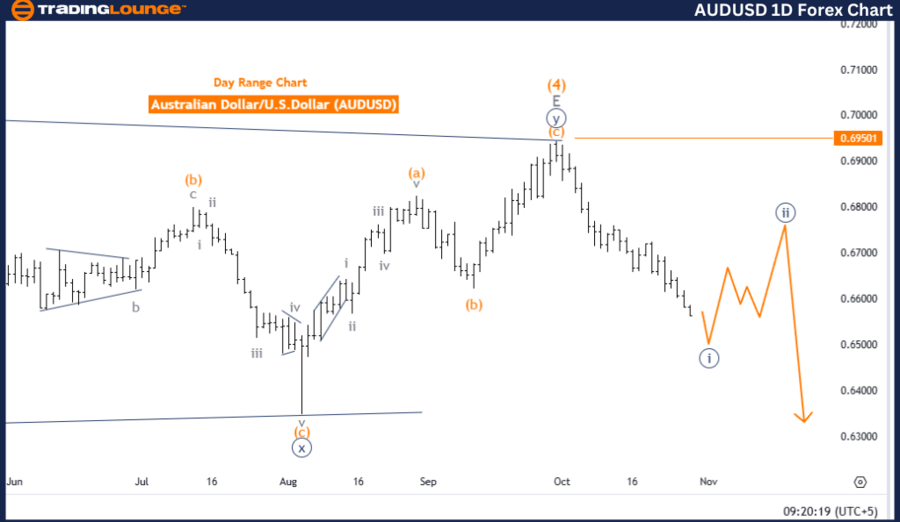
Details: Navy blue wave 1 of gray wave 1 is still active and nearing completion.
-
Wave cancel invalid level: 0.69501.
The daily Elliott Wave analysis of AUDUSD reflects a bearish trend with an impulsive mode in navy blue wave 1, which is part of a larger gray wave 1 structure. This pattern suggests that AUDUSD is in the early stages of a downward movement, with navy blue wave 1 still progressing, though it appears to be approaching its end. The impulsive characteristic of this trend supports a continued bearish outlook, reinforcing the downward momentum within the larger wave structure.
In this wave analysis, navy blue wave 1 represents the initial phase of a broader bearish cycle within gray wave 1. The completion of navy blue wave 1 will signify the end of the primary downward push, potentially setting the stage for navy blue wave 2, which could initiate a corrective phase. This anticipated wave 2 may bring a temporary counter-trend movement against the dominant bearish direction.
A critical level for this wave structure is set at 0.69501, marking the wave cancellation threshold. If the price rises above this level, the current wave count would be invalidated, suggesting a possible trend shift. However, as long as the price stays below this threshold, the bearish wave count remains intact, supporting the ongoing downward trend.
Summary: The AUDUSD daily chart analysis confirms a bearish trend in navy blue wave 1 of gray wave 1. With navy blue wave 1 approaching completion, there is potential for a transition into navy blue wave 2, which may introduce a corrective phase. The wave cancellation level at 0.69501 remains a crucial reference for validating the bearish wave structure and overall outlook.
AUD/USD Elliott Wave technical analysis
-
Function: Bearish Trend.
-
Mode: Impulsive.
-
Structure: Orange Wave 5.
-
Position: Navy Blue Wave 1.
-
Direction next higher degrees: Navy Blue Wave 2.
-
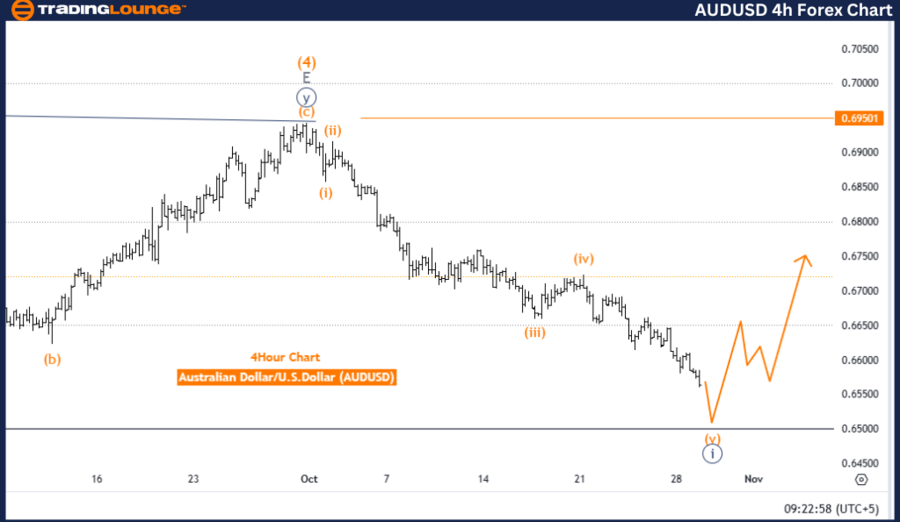
Details: Orange wave 4 of navy blue wave 1 appears complete; orange wave 5 of navy blue wave 1 is active and nearing completion.
-
Wave cancel invalid level: 0.69501.
The 4-hour Elliott Wave analysis for AUDUSD indicates a bearish trend with an impulsive structure, focusing on orange wave 5 within the broader navy blue wave 1. This structure suggests continued downward movement consistent with the prevailing bearish trend. With orange wave 4 appearing complete, orange wave 5 of navy blue wave 1 is currently advancing. In Elliott Wave theory, the fifth wave in an impulsive sequence often represents the last phase of the current trend, implying that navy blue wave 1 may be nearing its end.
Orange wave 5’s downward movement indicates the likely conclusion of navy blue wave 1 is approaching. As orange wave 5 progresses, it supports the bearish outlook, confirming that the trend direction remains downwards. Following the anticipated completion of navy blue wave 1, navy blue wave 2 may begin, which could introduce a short-term reversal or corrective phase.
The wave cancellation threshold for this structure is set at 0.69501, a critical level to uphold the current wave count. If the price rises above this level, it would invalidate the present wave structure and potentially alter the expected trend direction. However, as long as the price remains below this threshold, the impulsive, bearish structure remains valid.
Summary: The AUDUSD 4-hour chart displays a bearish, impulsive pattern in orange wave 5, marking the final phase of navy blue wave 1. The short-term trend is expected to continue downward until navy blue wave 1 concludes, after which a potential corrective phase in navy blue wave 2 may follow. The 0.69501 level remains a pivotal validation point for this analysis.
AUD/USD Elliott Wave technical analysis [Video]
Author

Peter Mathers
TradingLounge
Peter Mathers started actively trading in 1982. He began his career at Hoei and Shoin, a Japanese futures trading company.


