AUD/USD Elliott Wave technical analysis [Video]
![AUD/USD Elliott Wave technical analysis [Video]](https://editorial.fxstreet.com/images/Markets/Currencies/Majors/AUDUSD/us-and-australian-dollar-36988452_XtraLarge.jpg)
Australian Dollar/US Dollar (AUDUSD) day chart.
AUD/USD Elliott Wave technical analysis
-
Function: Bearish Trend.
-
Mode: Impulsive.
-
Structure: Navy blue wave 1.
-
Position: Gray wave 1.
-
Next higher degree: Navy blue wave 2.
Details
The Elliott Wave analysis for AUDUSD on the daily chart reveals a strong bearish trend in an impulsive mode. The market is currently unfolding within navy blue wave 1, which indicates the first stage of a broader downward trend.
At present, the position is in gray wave 1 within this navy blue wave 1 structure. This means the initial phase of the downtrend is still progressing, with navy blue wave 1 nearing its end but not yet completed.
Once navy blue wave 1 concludes, the market is expected to enter navy blue wave 2, marking a corrective phase. This phase would likely bring a pullback or temporary reversal, offering some relief from the current bearish momentum before resuming the larger downtrend.
Key level
The wave cancellation level is set at 0.69501, a critical price point. If the market rises above this level, it would invalidate the current wave count and prompt a reassessment of the overall structure.
Summary
The AUDUSD daily chart shows a continued bearish trend, with navy blue wave 1 nearing completion. The current market position is within gray wave 1, a part of the broader navy blue wave structure. Once navy blue wave 1 finishes, a corrective navy blue wave 2 is expected. Keep an eye on the 0.69501 price level, as breaching this point would invalidate the current Elliott Wave analysis.

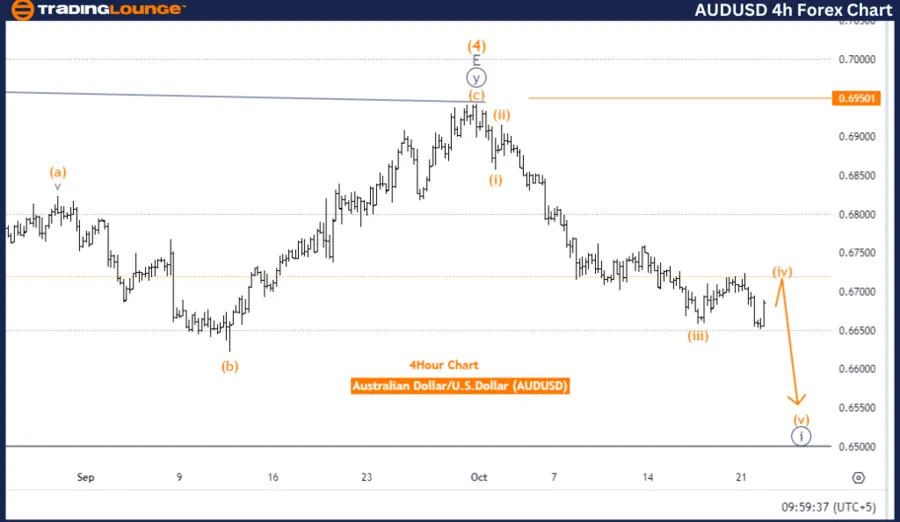
Australian Dollar/US Dollar (AUD/USD) four-hour chart
AUD/USD Elliott Wave technical analysis
-
Function: Counter Trend.
-
Mode: Corrective.
-
Structure: Orange wave 4.
-
Position: Navy blue wave 1.
-
Next lower degree: Orange wave 5.
Details
The Elliott Wave analysis on the AUDUSD 4-hour chart indicates a counter-trend scenario, signaling a corrective phase within the larger market structure. The current wave being observed is orange wave 4, which marks a corrective movement following the completion of the previous orange wave 3.
The market is positioned within navy blue wave 1, part of the larger orange wave sequence. With orange wave 3 completed, the market is now undergoing the corrective orange wave 4. This phase is seen as a temporary pullback within the larger bearish trend. Once orange wave 4 concludes, the market is expected to continue downward in orange wave 5.
Traders are focusing on the progression of orange wave 4, watching for signs that this corrective wave is nearing completion. This would indicate the market is preparing for the next downward impulse, orange wave 5.
- Wave Cancellation Level: 0.69501 – If the price exceeds this level, it would invalidate the current wave count and require a reassessment of the market structure.
Summary
The AUDUSD 4-hour chart reflects a corrective phase, with orange wave 4 currently unfolding after the completion of orange wave 3. The broader trend remains bearish, and once orange wave 4 completes, the market is expected to resume its downward movement into orange wave 5. The key level to watch is 0.69501, and remaining below this level supports the current Elliott Wave count.
AUD/USD Elliott Wave technical analysis [Video]
Author

Peter Mathers
TradingLounge
Peter Mathers started actively trading in 1982. He began his career at Hoei and Shoin, a Japanese futures trading company.


