AUD/USD Elliott Wave technical analysis [Video]
![AUD/USD Elliott Wave technical analysis [Video]](https://editorial.fxstreet.com/images/Markets/Currencies/Majors/AUDUSD/macro-of-aussie-100-note-8615104_XtraLarge.jpg)
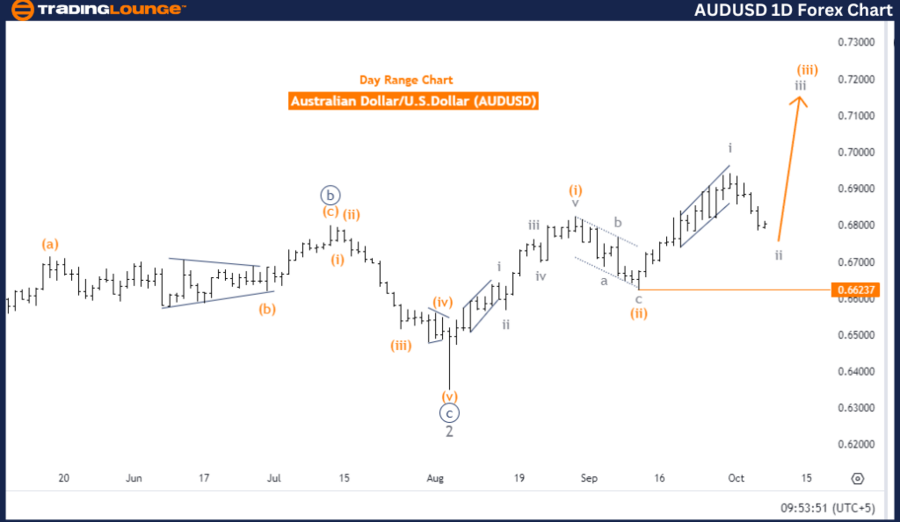
AUDUSD Elliott Wave Analysis Trading Lounge Day Chart.
Australian Dollar/U.S. Dollar (AUDUSD) Day Chart.
AUD/USD Elliott Wave technical analysis
-
Function: Counter Trend.
-
Mode: Corrective.
-
Structure: Gray Wave 2.
-
Position: Orange Wave 3.
-
Next higher degree direction: Gray Wave 3.
-
Details: Gray Wave 1 appears to be complete, with Gray Wave 2 currently in progress.
-
Wave cancel invalidation level: 0.66237.
The AUDUSD Elliott Wave Analysis for the daily chart shows that the market is currently in a counter-trend phase, defined by a corrective movement. This wave pattern operates in a corrective mode, suggesting that the market is undergoing a temporary pullback against the broader trend. The current wave structure under observation is Gray Wave 2, which is in effect following the completion of Gray Wave 1.
Gray Wave 1 has finished, signaling the end of the initial impulsive move. Now, the market has transitioned into Gray Wave 2, which is typically a corrective phase that follows the first impulsive wave. According to Elliott Wave Theory, Wave 2 usually retraces a portion of Wave 1 before the market resumes its primary trend, which is expected to happen in Gray Wave 3. Wave 3 is often the most extended and powerful wave in an Elliott Wave cycle, indicating that significant movement is likely to occur once the corrective phase concludes.
The next major movement, Gray Wave 3, is expected to continue the overarching trend once Gray Wave 2 completes its corrective cycle. The analysis highlights the importance of Gray Wave 2, as it will set the stage for the potential upward movement that follows.
The critical invalidation level for this wave structure is 0.66237. If the market drops below this level, the current wave count will be considered invalid, necessitating a reevaluation of the Elliott Wave structure. This level serves as a key reference point for confirming whether the ongoing corrective action will hold and whether the trend is likely to resume as anticipated.
Summary
The AUDUSD Elliott Wave Analysis for the daily chart indicates that Gray Wave 2 is active following the completion of Gray Wave 1. A corrective phase is underway, and the market is expected to shift into Gray Wave 3, which should result in substantial movement. The invalidation level of 0.66237 remains crucial for validating the wave structure.
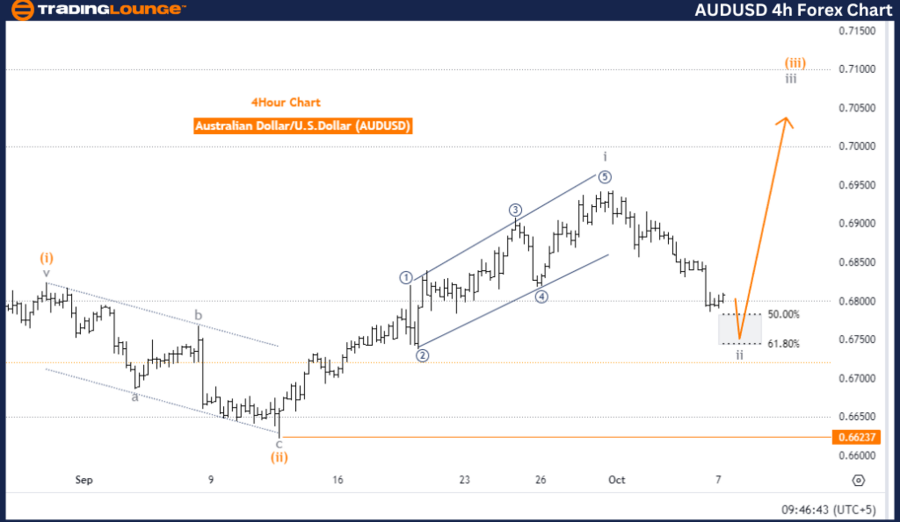
Australian Dollar/U.S. Dollar (AUDUSD) four-hour chart.
AUD/USD Elliott Wave technical analysis
-
Function: Counter Trend.
-
Mode: Corrective.
-
Structure: Gray Wave 2.
-
Position: Orange Wave 3.
-
Next higher degree direction: Gray Wave 3.
-
Details: Gray Wave 1 appears to be complete, and Gray Wave 2 is now in progress.
-
Wave cancel invalidation level: 0.66237.
The AUDUSD Elliott Wave Analysis for the 4-hour chart indicates that the market is currently in a counter-trend phase, which reflects a temporary correction against the broader trend. The mode of this movement is corrective, suggesting a pullback or pause within the overall trend. The wave structure under analysis is Gray Wave 2, which is developing within the ongoing corrective sequence.
At this stage, Gray Wave 1 is considered complete, and the market has now entered Gray Wave 2. According to Elliott Wave Theory, Wave 2 usually represents a retracement or correction after the impulsive move of Wave 1. This corrective phase is typically short-lived before the market resumes its primary trend.
Once Gray Wave 2 concludes, the next expected movement is Gray Wave 3. Wave 3 is generally one of the most powerful and extended waves within an Elliott Wave cycle, indicating a strong return to the dominant trend with significant momentum.
The critical invalidation level for this analysis is 0.66237. If the market falls below this level, the current Elliott Wave count will be invalidated, requiring a reassessment of the wave structure. This level is key in confirming the continuation of the corrective phase and the eventual transition into Gray Wave 3.
Summary
The AUDUSD Elliott Wave Analysis for the 4-hour chart shows that the market is in a corrective phase, with Gray Wave 2 currently in play following the completion of Gray Wave 1. Traders should anticipate the next move to be Gray Wave 3, which will resume the broader trend. The invalidation level of 0.66237 remains a crucial point for confirming the ongoing correction.
AUD/USD Elliott Wave technical analysis [Video]
Author

Peter Mathers
TradingLounge
Peter Mathers started actively trading in 1982. He began his career at Hoei and Shoin, a Japanese futures trading company.


