AUD/USD Elliott Wave technical analysis [Video]
![AUD/USD Elliott Wave technical analysis [Video]](https://editorial.fxstreet.com/images/Markets/Currencies/Majors/AUDUSD/australian-dollars-background-10439309_XtraLarge.jpg)
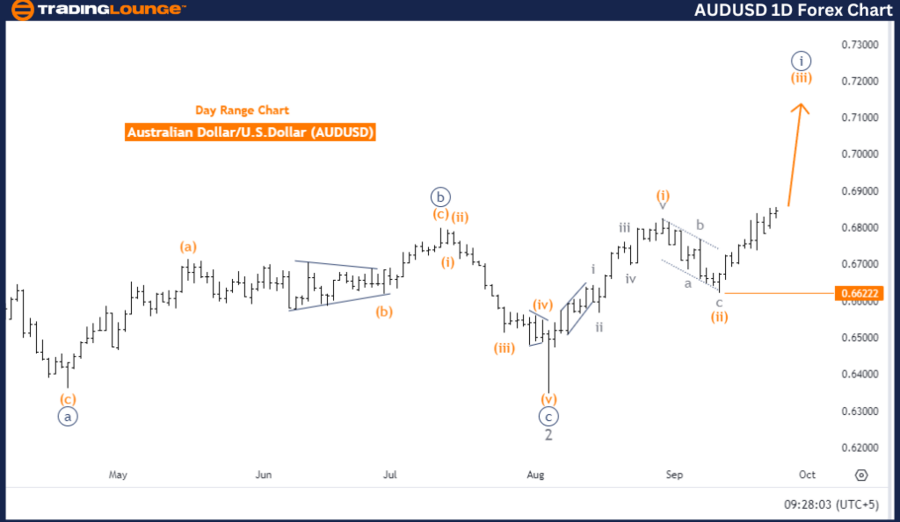
AUDUSD Elliott Wave Analysis - Trading Lounge Day Chart,
Australian Dollar/U.S. Dollar (AUDUSD) Day Chart
AUD/USD Elliott Wave technical analysis
Function: Bullish Trend.
Mode: Impulsive.
Structure: Orange Wave 3.
Position: Navy Blue Wave 1.
Direction next lower degrees: Orange Wave 4.
Details: Orange Wave 2 appears completed, and now Orange Wave 3 is in progress.
Wave cancel invalid level: 0.66222.
The AUDUSD Elliott Wave analysis on the daily chart indicates a bullish trend unfolding in an impulsive mode. The current wave structure is identified as Orange Wave 3, suggesting the market is within the third wave of a five-wave sequence, typically associated with strong upward momentum. The position of the structure is Navy Blue Wave 1, indicating the market is still in the early phase of its overall uptrend.
The analysis indicates that Orange Wave 2, which was a corrective phase, has likely completed, and Orange Wave 3 is now active. Wave 3, generally considered the strongest in an impulsive sequence, signals the potential for further upward movement in the sessions ahead.
Looking forward, the next direction in the lower degree is Orange Wave 4. This suggests that after Orange Wave 3 concludes, the market may undergo a brief corrective phase (Wave 4) before resuming its bullish trajectory in the final wave (Wave 5). The invalidation level for this wave structure is set at 0.66222. A drop below this level would invalidate the current Elliott Wave structure, requiring a reassessment of the market outlook.
In conclusion, the AUDUSD daily chart reflects a strong bullish trend. With Orange Wave 2 completed and Orange Wave 3 pushing the market higher, the outlook remains positive unless the price dips below 0.66222. Further gains are anticipated as the bullish trend progresses, with a potential correction expected after Orange Wave 3 completes, leading into Wave 4.
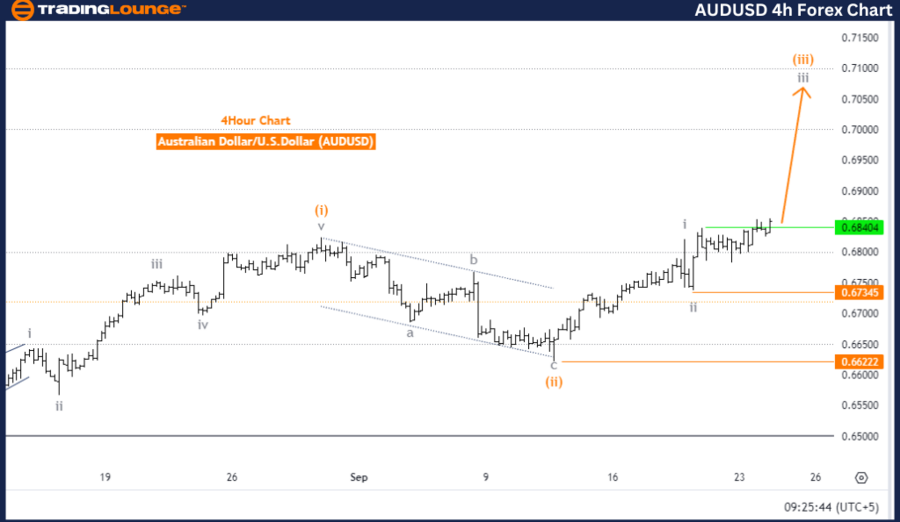
Australian Dollar/U.S. Dollar (AUDUSD) 4 Hour Chart.
AUD/USD Elliott Wave technical analysis
Function: Bullish Trend.
Mode: Impulsive.
Structure: Gray Wave 3.
Position: Orange Wave 3.
Direction next lower degrees: Gray Wave 4.
Details: Gray Wave 2 appears completed, and now Gray Wave 3 is in play.
Wave cancel invalid level: 0.66222.
The AUDUSD Elliott Wave analysis on the 4-hour chart reflects a developing bullish trend in impulsive mode. The current wave structure is identified as Gray Wave 3, indicating that the market is in the third wave of a larger five-wave sequence, often associated with strong upward momentum. The position within this structure is Orange Wave 3, suggesting the market is still in the middle of its upward trend, with further gains likely.
The analysis shows that Gray Wave 2, a corrective phase in the overall trend, appears to have completed. With this phase behind, Gray Wave 3 is now active, representing the continuation of the bullish trend. Typically, Wave 3 is the most extended and powerful in a five-wave sequence, suggesting that further upward movement in the market is expected.
The next lower degree of movement is Gray Wave 4, indicating that after Gray Wave 3 completes, the market may enter a temporary corrective phase before resuming the bullish trend. The wave cancel invalidation level is set at 0.66222. If the price falls below this level, the current wave structure would be invalidated, requiring a reassessment of the market outlook.
In summary, the AUDUSD 4-hour chart presents a strong bullish trend, with Gray Wave 3 currently driving the market higher. The completion of Gray Wave 2 has paved the way for additional price increases, and unless the price dips below 0.66222, the current wave structure remains valid. The market's bullish momentum is expected to continue, with further gains likely ahead.
Technical analyst: Malik Awais.
AUD/USD Elliott Wave technical analysis [Video]
Author

Peter Mathers
TradingLounge
Peter Mathers started actively trading in 1982. He began his career at Hoei and Shoin, a Japanese futures trading company.


