AUD/USD Elliott Wave technical analysis [Video]
![AUD/USD Elliott Wave technical analysis [Video]](https://editorial.fxstreet.com/images/Markets/Currencies/Majors/AUDUSD/australian-money-15191644_XtraLarge.jpg)
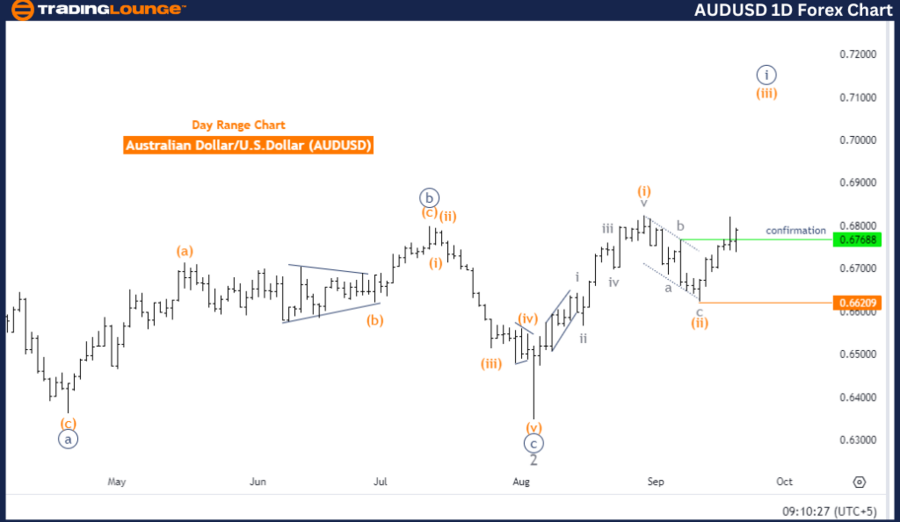
Australian Dollar/U.S. Dollar (AUDUSD) - Day Chart.
AUD/USD Elliott Wave technical analysis
-
Function: Bullish Trend.
-
Mode: Impulsive.
-
Structure: Orange wave 3.
-
Position: Navy blue wave 1.
-
Direction (next higher degrees): Orange wave 3 (in progress).
-
Invalidation Level: 0.66209.
The AUDUSD Elliott Wave analysis on the daily chart shows that the pair is in a bullish trend. The market is in an impulsive mode, indicating strong movement in the direction of the overall trend.
The key structure being analyzed is orange wave 3, which has already started. Currently, the price is within navy blue wave 1, a smaller wave inside the broader structure of orange wave 3.
Details
The analysis suggests that orange wave 2 is likely completed, and orange wave 3 is now active. This means that the corrective phase has ended, and the market is resuming its upward movement. The impulsive wave is expected to push the pair higher in line with the broader bullish trend.
As long as the pair stays above the invalidation level of 0.66209, the current Elliott Wave count remains valid, signaling further upward movement.
Summary
-
Trend: Bullish.
-
Current structure: Orange wave 3 (in progress).
-
Completed phase: Orange wave 2.
-
Expected movement: Continued upward.
-
Invalidation level: 0.66209.
If the price remains above the invalidation level, the bullish scenario stays intact, and the market is likely to continue its upward movement within the impulsive wave structure.
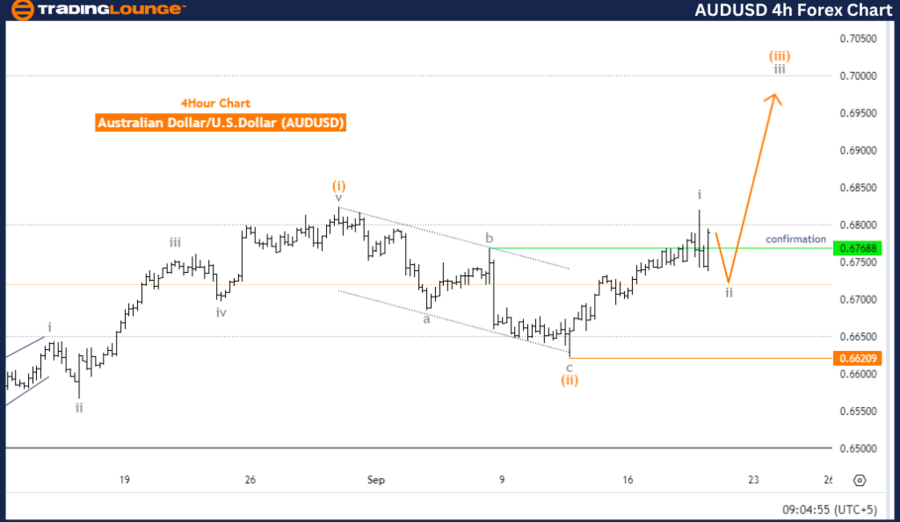
Australian Dollar/U.S. Dollar (AUDUSD) - four-hour chart.
AUD/USD Elliott Wave technical analysis
-
Function: Counter Trend.
-
Mode: Corrective.
-
Structure: Gray wave 2.
-
Position: Orange wave 3.
-
Direction (next higher degrees): Gray wave 3.
-
Invalidation level: 0.66209.
The AUDUSD Elliott Wave analysis on the 4-hour chart shows the market is in a counter-trend phase, moving against the larger trend. This corrective mode indicates that the current movement is a temporary retracement within the broader trend.
The structure being analyzed is gray wave 2, which follows the completion of gray wave 1. This means that the initial impulsive move of gray wave 1 has concluded, and the market is now in gray wave 2, a corrective phase. During this phase, the price may consolidate or retrace before the next impulsive wave begins.
Details
The next expected movement is gray wave 3, which will resume the broader trend once gray wave 2 completes. Currently, the market is positioned within orange wave 3, part of the gray wave 2 corrective structure. This suggests that after the completion of gray wave 1, orange wave 3 is playing out as a sub-wave within the larger corrective wave.
The invalidation level is set at 0.66209. If the price drops below this level, the current Elliott Wave count will be invalidated, requiring a reassessment of the wave pattern.
Summary
-
Trend: Counter-trend (Corrective).
-
Current structure: Gray wave 2 (in progress).
-
Completed phase: Gray wave 1.
-
Expected movement: Gray wave 3 (after gray wave 2 completes).
-
Invalidation level: 0.66209.
If the price stays above the invalidation level, the corrective structure will remain valid, with gray wave 3 expected to resume the broader trend once gray wave 2 completes.
AUD/USD Elliott Wave technical analysis [Video]
Author

Peter Mathers
TradingLounge
Peter Mathers started actively trading in 1982. He began his career at Hoei and Shoin, a Japanese futures trading company.


