AUD/USD Elliott Wave technical analysis [Video]
![AUD/USD Elliott Wave technical analysis [Video]](https://editorial.fxstreet.com/images/Markets/Currencies/Majors/AUDUSD/australian-money-2249329_XtraLarge.jpg)
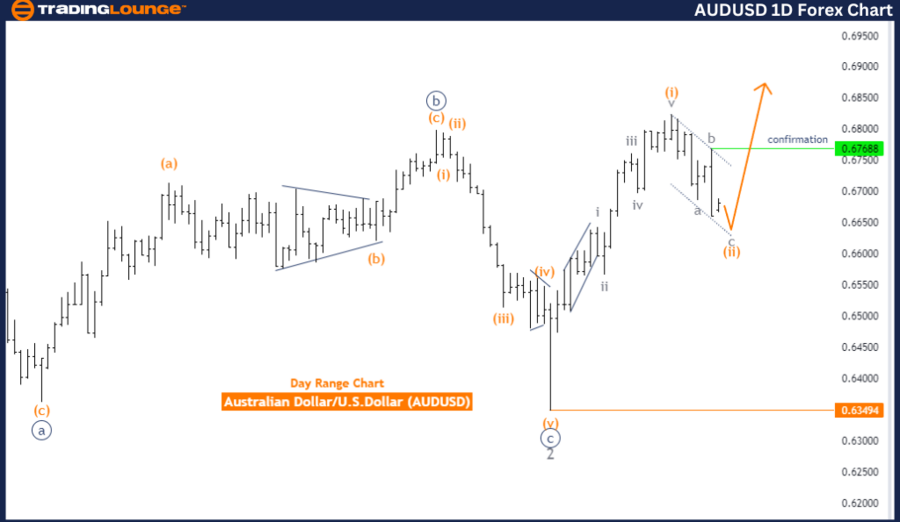
AUDUSD Elliott Wave Analysis Trading Lounge Day Chart, Australian Dollar/U.S. Dollar (AUDUSD).
AUD/USD Elliott Wave technical analysis
-
Function: Counter Trend.
-
Mode: Corrective.
-
Structure: Orange wave 2.
-
Position: Navy Blue Wave 1.
-
Next Higher Degree Direction: Orange wave 3.
Details:
-
Orange Wave 1 is completed, and now Orange Wave 2 is in progress and nearing its conclusion.
-
Wave Cancel Invalidation Level: 0.63494.
The AUDUSD Elliott Wave Analysis on the Day Chart indicates that a corrective counter trend is currently in motion. The main structure being observed is orange wave 2, which is actively unfolding. Before this, orange wave 1 was marked as complete, leading into the development of wave 2. The analysis suggests that orange wave 2 is approaching its end, which will pave the way for the next market movement phase: orange wave 3.
The market’s current position is within navy blue wave 1, marking the early stages of the overall Elliott Wave pattern. As orange wave 2 nears completion, the next expected movement is the initiation of orange wave 3, which is aligned with the higher-degree trend.
In this corrective phase, the market is undergoing a retracement or consolidation period before resuming the broader impulsive trend, represented by orange wave 3. The critical invalidation level for the wave structure is noted at 0.63494. If the market drops below this point, the current wave configuration would be invalidated.
Overall, the chart points to the near completion of the corrective wave 2 phase and anticipates the start of wave 3, potentially continuing the upward trend in AUDUSD.
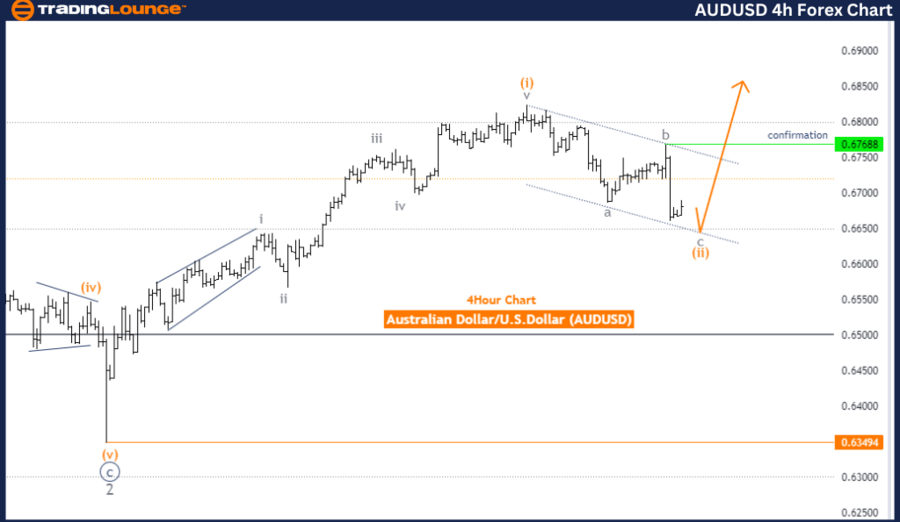
AUDUSD Elliott Wave Analysis Trading Lounge 4-Hour Chart, Australian Dollar/U.S. Dollar (AUDUSD).
AUD/USD Elliott Wave technical analysis
-
Function: Counter Trend.
-
Mode: Corrective.
-
Structure: Orange wave 2.
-
Position: Navy Blue Wave 1.
-
Next Higher Degree Direction: Orange wave 3.
Details:
-
Orange wave 1 is completed, and now Orange Wave 2 is in play and nearing its end.
-
Wave Cancel Invalidation Level: 0.63494.
The AUDUSD Elliott Wave analysis on the 4-hour chart highlights a counter-trend move within a corrective mode. The current structure being tracked is orange wave 2, which follows the completion of orange wave 1. The wave position is now at navy blue wave 1, indicating that the market is in a corrective phase.
The next higher-degree movement is anticipated to bring orange wave 3. After the completion of the current orange wave 2, the market is expected to move into a new impulsive upward phase as part of orange wave 3. The analysis shows that orange wave 1 has already finished, and orange wave 2 is now nearing completion.
The key invalidation level to watch is set at 0.63494. If the market drops below this point, it would invalidate the current wave count and require a reassessment of the market's wave structure. Until then, it is expected that once orange wave 2 completes, the market will shift into an upward trend with the development of orange wave 3.
In summary, the AUDUSD 4-hour chart shows the market in a corrective phase within a counter-trend, with orange wave 2 nearing its end. Afterward, orange wave 3 is expected to take control, leading to upward price movement. The invalidation level of 0.63494 is crucial for traders to monitor, as a break below this level would negate the current wave structure.
Technical analyst: Malik Awais.
AUD/USD Elliott Wave technical analysis [Video]
Author

Peter Mathers
TradingLounge
Peter Mathers started actively trading in 1982. He began his career at Hoei and Shoin, a Japanese futures trading company.


