AUD/USD Elliott Wave technical analysis [Video]
![AUD/USD Elliott Wave technical analysis [Video]](https://editorial.fxstreet.com/images/Markets/Currencies/Majors/AUDUSD/australian-money-36572798_XtraLarge.jpg)
AUD/USD Elliott Wave technical analysis
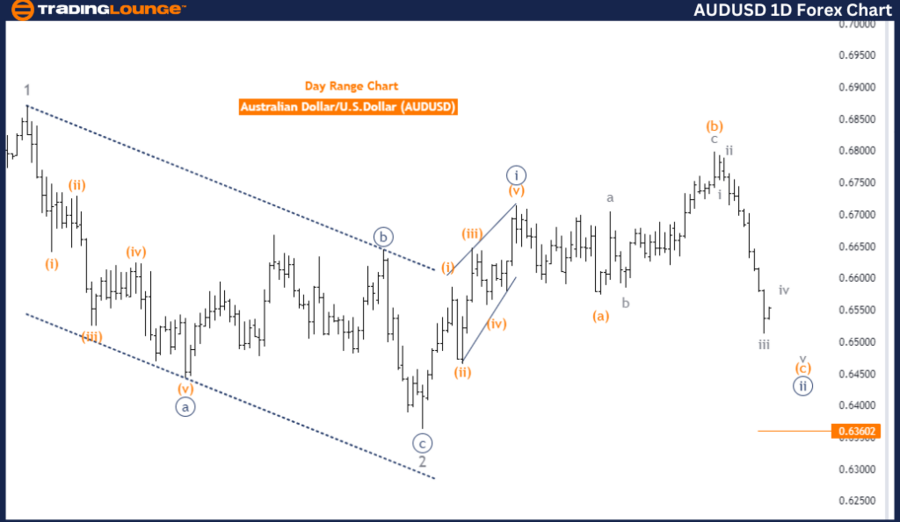
Function: Counter Trend.
Mode: Impulsive as C.
Structure: Orange Wave C.
Position: Navy Blue Wave 2.
Next higher degree direction: Navy Blue Wave 3.
Details: The analysis suggests that orange wave b appears to be complete, and orange wave C of 2 is now underway.
Wave cancel invalid level: 0.63602.
The AUDUSD Elliott Wave Analysis on the daily chart indicates a counter-trend phase, characterized by an impulsive wave C. The current structure is identified as orange wave C, situated within navy blue wave 2. This implies that the market is in the final corrective phase before possibly resuming the main trend.
The forecast points towards navy blue wave 3 as the next significant movement, indicating that after completing wave C within wave 2, the market could enter wave 3 of a larger degree, typically associated with a strong trend.
An important detail in this analysis is that orange wave b is considered complete, and the market is currently in the impulsive phase of orange wave C within wave 2. This phase signifies a reversal from the corrective phase of wave b, moving in the opposite direction.
The wave cancel invalid level is set at 0.63602. This level serves as a critical validation point for the current wave structure. Should the market price fall below this threshold, the current wave analysis would be invalidated, necessitating a revision of the analysis.
In summary, the AUDUSD daily chart analysis reveals a counter-trend phase within orange wave C, positioned in navy blue wave 2. With the completion of wave B, the market has entered the impulsive phase of wave C. Upon completing this phase, the market is expected to transition into navy blue wave 3, resuming the primary trend. The wave cancel invalid level at 0.63602 acts as a crucial threshold for validating the current wave analysis.
AUD/USD Elliott Wave technical analysis
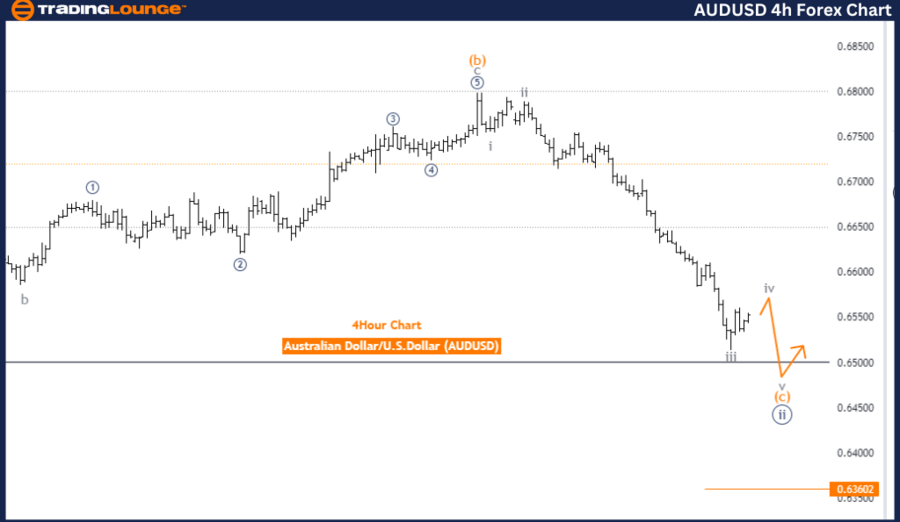
Function: Counter Trend.
Mode: Corrective.
Structure: Gray Wave 4.
Position: Orange Wave C.
Next lower degree direction: Gray Wave 5.
Details: The analysis indicates that gray wave 3 appears complete, and gray wave 4 of C is now in progress.
Wave cancel invalid level: 0.63602.
The AUDUSD Elliott Wave Analysis on the 4-hour chart suggests that the market is currently in a counter-trend phase, classified as corrective. This phase indicates a temporary pause or reversal within a larger trend. The current wave structure under review is gray wave 4, positioned within orange wave C, suggesting a corrective or consolidative movement typical of a fourth wave in a larger sequence.
The analysis forecasts that the next lower degree direction will be gray wave 5, indicating that upon completing the current corrective phase (gray wave 4), the market is expected to transition into gray wave 5. This transition is anticipated to resume the main trend, potentially leading to further price movements.
A key aspect of this analysis is the completion of gray wave 3, with the market now in gray wave 4 of C. This positioning suggests a consolidation or sideways movement, with the market not trending strongly in either direction, but rather moving in a more horizontal pattern.
An important factor to note is the wave cancel invalid level, set at 0.63602. This level acts as a crucial validation point for the current wave structure. If the market price falls below this level, it would invalidate the current wave analysis, indicating that the expected wave pattern is no longer applicable and necessitating a revision of the analysis.
In summary, the AUDUSD 4-hour chart analysis reveals that the market is in a corrective counter-trend phase within gray wave 4, situated in orange wave C. The market is currently consolidating, and upon completion of this phase, it is expected to move into gray wave 5, resuming the primary trend direction. The wave cancel invalid level is set at 0.63602, serving as a critical threshold for validating the current wave analysis.
AUD/USD Elliott Wave technical analysis [Video]
Author

Peter Mathers
TradingLounge
Peter Mathers started actively trading in 1982. He began his career at Hoei and Shoin, a Japanese futures trading company.


