AUD/USD Elliott Wave analysis: Short term favors downside from bounces

We believe the AUD/USD is still within a bearish corrective cycle from late September 2024. Thus, the current minor bounce should fail at some point, leading to a further intraday sell-off.
From the perspective of Elliott wave theory, price action evolves in a series of 5-waves and 3-waves that depict trend and correction, respectively. The theory also postulates that a trend develops in 5-waves. When a 5-wave sequence is completed, a 3-wave correction should occur against the direction of the trend. These 5-waves and 3-waves combine to form market cycles across all time frames.
A bullish sequence evolved in AUDUSD from the low of August 2024. This sequence completed a 5-wave impulse structure on September 30th. The expectation was that a 3-wave correction to the downside would follow. Meanwhile, corrections can take different forms. However, the most recognizable and tradable are what we call zigzags. Zigzags can either complete a 3, 7, or 11 swing structure, i.e., A-B-C, W-X-Y, or W-X-Y-XX-Z sequences, respectively. When the first sub-structure within the corrective phase is a 5-wave, we often anticipate an A-B-C structure. A-B-C structures are 5-3-5 wave sequences, which we refer to as zigzag patterns.
AUD/USD Elliott Wave analysis – 10.17.2024 update
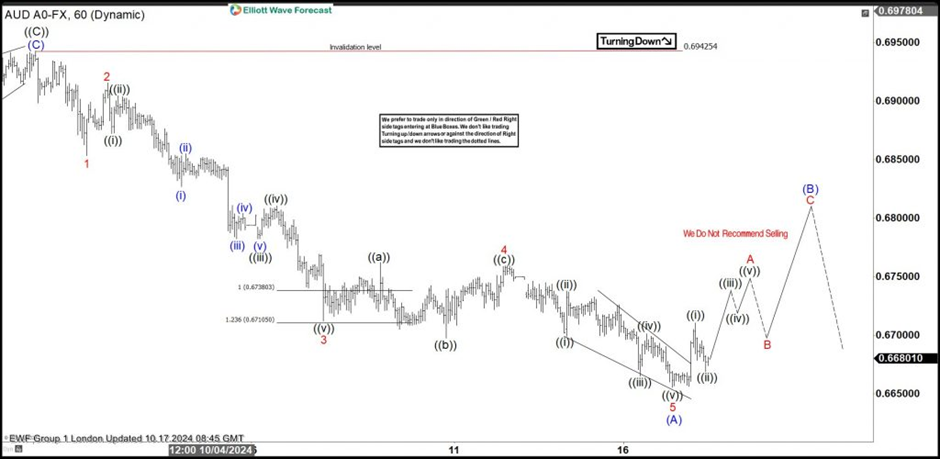
We shared the chart above on 10/17/2024 with Elliottwave-Forecast members, showing the path in the shorter cycles. The chart displays a bearish correction of the bullish sequence from the low of August. The first reaction was a 5-wave down, completing wave (A). With this structure, we can anticipate an A-B-C zigzag pattern involving a 5-3-5 wave sequence. Thus, the price is currently in wave (B) if it extends higher to at least the 23.6% retracement zone at 0.6725. However, if the current bounce ends below 0.6725, then it’s not sufficient for (B). In that case, we could consider it as a new wave 4 of (A) or wave ((ii)) of 5, leading to a further sell-off for wave (A).
On the other hand, if the bounce develops above 0.6725 to qualify for wave (B), we will expect a 3, 7, or 11 swing structure and anticipate where wave (B) should end. At the extreme of (B), we expect new attempts by sellers to push lower below (A) along the path of (C). However, to join the sellers, we would like to confirm the end of wave (B) by waiting for the price to breach the low of wave (A). Afterward, we would sell on bounces in 3, 7, or 11 swing structures, targeting 100% of wave (A) from (B). When it’s time to sell, our members will be alerted in the trading room and by the blue box on our charts. The blue box provides entry and exit prices. Additionally, in the trading room, our analysts share trade management tips for every setup.
Author

Elliott Wave Forecast Team
ElliottWave-Forecast.com


